Toyota 2007 Annual Report Download - page 79
Download and view the complete annual report
Please find page 79 of the 2007 Toyota annual report below. You can navigate through the pages in the report by either clicking on the pages listed below, or by using the keyword search tool below to find specific information within the annual report.-
 1
1 -
2
-
3
-
4
-
5
-
6
-
7
-
8
-
9
-
10
-
11
-
12
-
13
-
14
-
15
-
16
-
17
-
18
-
19
-
20
-
21
-
22
-
23
-
24
-
25
-
26
-
27
-
28
-
29
-
30
-
31
-
32
-
33
-
34
-
35
-
36
-
37
-
38
-
39
-
40
-
41
-
42
-
43
-
44
-
45
-
46
-
47
-
48
-
49
-
50
-
51
-
52
-
53
-
54
-
55
-
56
-
57
-
58
-
59
-
60
-
61
-
62
-
63
-
64
-
65
-
66
-
67
-
68
-
 69
69 -
 70
70 -
 71
71 -
 72
72 -
 73
73 -
 74
74 -
 75
75 -
 76
76 -
 77
77 -
 78
78 -
 79
79 -
 80
80 -
 81
81 -
 82
82 -
 83
83 -
 84
84 -
 85
85 -
 86
86 -
 87
87 -
 88
88 -
 89
89 -
90
-
91
-
92
-
93
-
94
-
95
-
96
-
97
-
98
-
99
-
100
-
101
-
102
-
103
-
104
-
105
-
106
-
107
-
108
-
109
-
110
-
111
-
112
-
113
-
114
-
115
-
116
-
117
-
118
-
119
-
120
-
121
-
122
-
123
-
124
-
125
-
126
-
127
-
128
-
129
-
130
-
131
-
132
-
133
-
134
-
135
-
136
-
137
-
138
-
139
-
140
 |
 |

ANNUAL REPORT 2007 77
conditions, prevailing interest rates and Toyota’s financial
strength. Funding costs increased during fiscal 2006 and 2007 as
a result of higher interest rates and an increase in borrowings,
primarily in the United States.
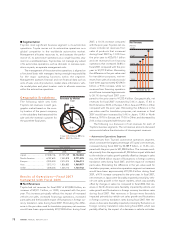
Toyota launched its credit card business in Japan at the
beginning of fiscal 2002. As of March 31, 2006, Toyota had 5.4
million cardholders, an increase of 0.7 million cardholders com-
pared with March 31, 2005, and as of March 31, 2007, Toyota had
6.1 million cardholders, an increase of 0.7 million cardholders
compared with March 31, 2006. Corresponding to the increase in
cardholders, the credit card receivables at March 31, 2006
increased by ¥27.0 billion from March 31, 2005 to ¥171.2 billion.
The credit card receivables at March 31, 2007 increased by ¥30.0
billion from March 31, 2006 to ¥201.2 billion.
■Other Business Operations
Toyota’s other business operations consist of housing, including
the manufacture and sale of prefabricated homes; information
technology related businesses, including information technology
and telecommunications, intelligent transport systems, GAZOO;
marine, biotechnology and afforestation.
Toyota does not expect its other business operations to
materially contribute to Toyota’s consolidated results of operations.
■Currency Fluctuations
Toyota is sensitive to fluctuations in foreign currency exchange
rates. In addition to the Japanese yen, Toyota is principally
exposed to fluctuations in the value of the U.S. dollar and the
euro and, to a lesser extent, the British pound and the Australian
dollar. Toyota’s consolidated financial statements, which are pre-
sented in Japanese yen, are affected by foreign currency
exchange fluctuations through both translation risk and transac-
tion risk. Changes in foreign currency exchange rates may posi-
tively or negatively affect Toyota’s revenues, operating costs and
expenses, gross margins, operating income, net income and
retained earnings.
Translation risk is the risk that Toyota’s consolidated financial
statements for a particular period or for a particular date will be
affected by changes in the prevailing exchange rates of the cur-
rencies in those countries in which Toyota does business com-
pared with the Japanese yen. Even though the fluctuations of
currency exchange rates to the Japanese yen can be substantial,
and, therefore, significantly impact comparisons with prior peri-
ods and among the various geographic markets, the translation
effect is a reporting consideration and does not reflect Toyota’s
underlying results of operations. Toyota does not hedge against
translation risk.
Transaction risk is the risk that the currency structure of
Toyota’s costs and liabilities will deviate from the currency struc-
ture of sales proceeds and assets. Transaction risk relates primari-
ly to sales proceeds from Toyota’s non-domestic operations from
vehicles produced in Japan.
Toyota believes that the location of its production facilities in
different parts of the world has significantly reduced the level of
transaction risk. As part of its globalization strategy, Toyota has
continued to localize production by constructing production facil-
ities in the major markets in which it sells its vehicles. In calendar
2005 and 2006, Toyota produced 62.0% and 61.1% of Toyota’s
non-domestic sales outside Japan, respectively. In North
America, 61.1% and 54.7% of vehicles sold in calendar 2005 and
2006 were produced locally, respectively. In Europe, 59.6% and
70.7% of vehicles sold in calendar 2005 and 2006 were produced
locally, respectively. Localizing production enables Toyota to pur-
chase many of the supplies and resources used in the production
process, which allows for a better match of local currency rev-
enues with local currency expenses.
Toyota also enters into foreign currency transactions and
other hedging instruments to address a portion of its transaction
risk. This has reduced, but not eliminated, the effects of foreign
currency exchange rate fluctuations, which in some years can be
significant. See notes 20 and 21 to the consolidated financial
statements for additional information regarding the extent of
Toyota’s use of derivative financial instruments to hedge foreign
currency exchange rate risks.
Generally, a weakening of the Japanese yen against other
currencies has a positive effect on Toyota’s revenues, operating
income and net income. A strengthening of the Japanese yen
against other currencies has the opposite effect. The Japanese
yen has on average been weaker against the U.S. dollar and the
euro during fiscal 2006 and 2007. At the end of fiscal 2006 and
2007, the Japanese yen was weaker against the U.S. dollar and
the euro in comparison to the end of the respective prior fiscal
year. See further discussion in the Market Risk Disclosures section
regarding “Foreign Currency Exchange Rate Risk”.
During fiscal 2006 and 2007, the average value of the yen
fluctuated against the major currencies including the U.S. dollar
and euro compared with the average value of the previous fiscal
year, respectively. The operating results excluding the impact of
currency fluctuations described in the “Results of Operations—
Fiscal 2007 Compared with Fiscal 2006” and the “Results of
Operations—Fiscal 2006 Compared with Fiscal 2005” show
results of net revenues obtained by applying the yen’s average
exchange rate in the previous fiscal year to the local currency-
denominated net revenues for fiscal 2006 and 2007, respectively,
as if the value of the yen had remained constant for the compara-
ble periods. Results excluding the impact of currency fluctuations
year-on-year are not on the same basis as Toyota’s consolidated
financial statements and do not conform with U.S. GAAP.
Furthermore, Toyota does not believe that these measures are a
substitute for U.S. GAAP measures. However, Toyota believes
that such results excluding the impact of currency fluctuations
year-on-year provide additional useful information to investors
regarding the operating performance on a local currency basis.