Toyota 2007 Annual Report Download - page 107
Download and view the complete annual report
Please find page 107 of the 2007 Toyota annual report below. You can navigate through the pages in the report by either clicking on the pages listed below, or by using the keyword search tool below to find specific information within the annual report.-
 1
1 -
2
-
3
-
4
-
5
-
6
-
7
-
8
-
9
-
10
-
11
-
12
-
13
-
14
-
15
-
16
-
17
-
18
-
19
-
20
-
21
-
22
-
23
-
24
-
25
-
26
-
27
-
28
-
29
-
30
-
31
-
32
-
33
-
34
-
35
-
36
-
37
-
38
-
39
-
40
-
41
-
42
-
43
-
44
-
45
-
46
-
47
-
48
-
49
-
50
-
51
-
52
-
53
-
54
-
55
-
56
-
57
-
58
-
59
-
60
-
61
-
62
-
63
-
64
-
65
-
66
-
67
-
68
-
69
-
70
-
71
-
72
-
73
-
74
-
75
-
76
-
77
-
78
-
79
-
80
-
81
-
82
-
83
-
84
-
85
-
86
-
87
-
88
-
89
-
90
-
91
-
92
-
93
-
94
-
95
-
96
-
 97
97 -
 98
98 -
 99
99 -
 100
100 -
 101
101 -
 102
102 -
 103
103 -
 104
104 -
 105
105 -
 106
106 -
 107
107 -
 108
108 -
 109
109 -
 110
110 -
 111
111 -
 112
112 -
 113
113 -
 114
114 -
 115
115 -
 116
116 -
 117
117 -
118
-
119
-
120
-
121
-
122
-
123
-
124
-
125
-
126
-
127
-
128
-
129
-
130
-
131
-
132
-
133
-
134
-
135
-
136
-
137
-
138
-
139
-
140
 |
 |

ANNUAL REPORT 2007 105
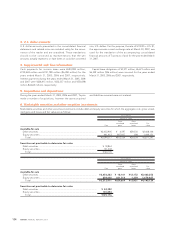
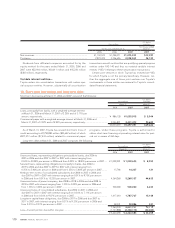
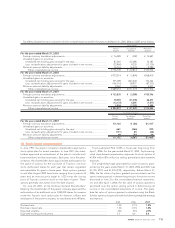
U.S. dollars in millions
March 31, 2007
Gross Gross
unrealized unrealized Fair
Cost gains` losses value
Available-for-sale
Debt securities ................................................................................................. $20,790 $ 154 $103 $20,841
Equity securities ............................................................................................... 7,282 6,959 11 14,230
Total .............................................................................................................. $28,072 $ 7,113 $114 $35,071
Securities not practicable to determine fair value
Debt securities ................................................................................................. $ 206
Equity securities ............................................................................................... 855
Total .............................................................................................................. $1,061
Unrealized losses continuing over a 12 month period or more
in the aggregate were not material at March 31, 2006 and 2007.
At March 31, 2006 and 2007, debt securities classified as
available-for-sale mainly consist of government bonds and cor-
porate debt securities with maturities from 1 to 10 years.
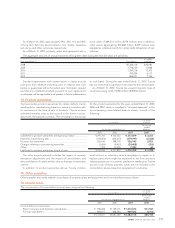
Proceeds from sales of available-for-sale securities were
¥121,369 million, ¥157,707 million and ¥148,442 million ($1,257
million) for the years ended March 31, 2005, 2006 and 2007,
respectively. On those sales, gross realized gains were ¥14,551
million, ¥2,104 million and ¥8,832 million ($75 million) and gross
realized losses were ¥231 million, ¥1,207 million and ¥317 mil-
lion ($3 million), respectively.
During the year ended March 31, 2006, in accordance with
EITF Issue No. 91-5, Nonmonetary Exchange of Cost-Method
Investments, Toyota reclassified ¥143,366 million of gain from
Unrealized gains on securities included in the “Accumulated
other comprehensive income” on the consolidated balance
sheet to Other income included in the “Other income, net” on
the consolidated statement of income. The gain was recog-
nized based on the merger between UFJ Holdings, Inc. and
Mitsubishi Tokyo Financial Group, Inc. on October 1, 2005, and
determined as the amount between the cost of the pre-merger
entity, UFJ Holdings, Inc. common shares which Toyota had
continuously held and the fair market value of the post-merger
entity, Mitsubishi UFJ Financial Group, Inc. common shares
which Toyota received in exchange for UFJ Holdings, Inc. com-
mon shares. The gain was non-cash gain and included in the
cost of the available-for-sale equity securities.
During the years ended March 31, 2005, 2006 and 2007,
Toyota recognized impairment losses on available-for-sale
securities of ¥2,324 million, ¥4,163 million, and ¥4,614 million
($39 million), respectively, which are included in “Other income,
net” in the accompanying consolidated statements of income.
In the ordinary course of business, Toyota maintains long-
term investment securities, included in “Marketable securities
and other securities investments” and issued by a number of
non-public companies which are recorded at cost, as their fair
values were not readily determinable. Management employs a
systematic methodology to assess the recoverability of such
investments by reviewing the financial viability of the underlying
companies and the prevailing market conditions in which these
companies operate to determine if Toyota’s investment in each
individual company is impaired and whether the impairment is
other-than-temporary. Toyota performs this impairment test
semi-annually for significant investments recorded at cost. If the
impairment is determined to be other-than-temporary, the car-
rying value of the investment is written-down by the impaired
amount and the losses are recognized currently in operations.
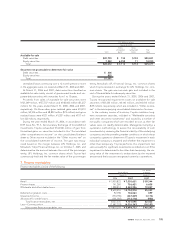
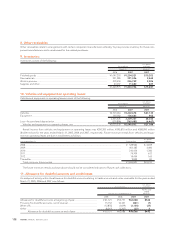
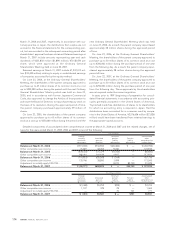
7. Finance receivables:
Finance receivables consist of the following:
U.S. dollars
Yen in millions` in millions
March 31, March 31,
2006 2007 2007
Retail ....................................................................................................................................... ¥ 5,930,822 ¥ 7,005,631 $ 59,344
Finance leases........................................................................................................................ 741,280 756,421 6,408
Wholesale and other dealer loans........................................................................................ 1,998,814 2,342,926 19,847
8,670,916 10,104,978 85,599
Deferred origination costs .................................................................................................... 92,798 106,063 899
Unearned income .................................................................................................................. (334,796) (367,829) (3,116)
Allowance for credit losses ................................................................................................... (101,383) (112,116) (950)
Total finance receivables, net....................................................................................... 8,327,535 9,731,096 82,432
Less—Current portion ........................................................................................................... (3,497,319) (4,036,363) (34,192)
Noncurrent finance receivables, net............................................................................ ¥ 4,830,216 ¥ 5,694,733 $ 48,240