Toyota 2007 Annual Report Download - page 133
Download and view the complete annual report
Please find page 133 of the 2007 Toyota annual report below. You can navigate through the pages in the report by either clicking on the pages listed below, or by using the keyword search tool below to find specific information within the annual report.-
 1
1 -
2
-
3
-
4
-
5
-
6
-
7
-
8
-
9
-
10
-
11
-
12
-
13
-
14
-
15
-
16
-
17
-
18
-
19
-
20
-
21
-
22
-
23
-
24
-
25
-
26
-
27
-
28
-
29
-
30
-
31
-
32
-
33
-
34
-
35
-
36
-
37
-
38
-
39
-
40
-
41
-
42
-
43
-
44
-
45
-
46
-
47
-
48
-
49
-
50
-
51
-
52
-
53
-
54
-
55
-
56
-
57
-
58
-
59
-
60
-
61
-
62
-
63
-
64
-
65
-
66
-
67
-
68
-
69
-
70
-
71
-
72
-
73
-
74
-
75
-
76
-
77
-
78
-
79
-
80
-
81
-
82
-
83
-
84
-
85
-
86
-
87
-
88
-
89
-
90
-
91
-
92
-
93
-
94
-
95
-
96
-
97
-
98
-
99
-
100
-
101
-
102
-
103
-
104
-
105
-
106
-
107
-
108
-
109
-
110
-
111
-
112
-
113
-
114
-
115
-
116
-
117
-
118
-
119
-
120
-
121
-
122
-
 123
123 -
 124
124 -
 125
125 -
 126
126 -
 127
127 -
 128
128 -
 129
129 -
 130
130 -
 131
131 -
 132
132 -
 133
133 -
 134
134 -
 135
135 -
 136
136 -
 137
137 -
 138
138 -
 139
139 -
 140
140
 |
 |

ANNUAL REPORT 2007 131
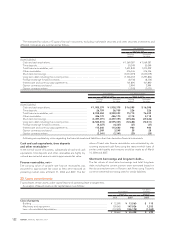
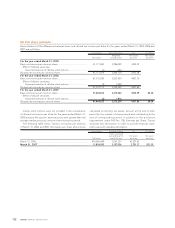
Yen in millions U.S.dollars in millions
For the year ended March 31, 2007 For the year ended March 31, 2007
Non-Financial Financial Non-Financial Financial
Services Services Services Services
Businesses Businesses Consolidated Businesses Businesses Consolidated
Cash flows from operating activities
Net income ................................................................... ¥ 1,531,093 ¥ 112,987 ¥ 1,644,032 $ 12,970 $ 957 $ 13,927
Adjustments to reconcile net income to net cash
provided by operating activities
Depreciation............................................................. 979,718 402,876 1,382,594 8,299 3,413 11,712
Provision for doubtful accounts
and credit losses..................................................... (841) 72,703 71,862 (7) 616 609
Pension and severance costs, less payments ........ (33,319) 1,265 (32,054) (282) 10 (272)
Losses on disposal of fixed assets .......................... 49,193 1,279 50,472 417 11 428
Unrealized losses on available-for-sale
securities, net.......................................................... 4,614 — 4,614 39 — 39
Deferred income taxes ............................................ 42,698 89,643 132,308 362 759 1,121
Minority interest in consolidated subsidiaries ....... 49,513 174 49,687 419 2 421
Equity in earnings of affiliated companies............. (193,130) (16,385) (209,515) (1,636) (139) (1,775)
Changes in operating assets and liabilities,
and other................................................................. 182,548 125,700 144,173 1,546 1,065 1,221
Net cash provided by operating activities......... 2,612,087 790,242 3,238,173 22,127 6,694 27,431
Cash flows from investing activities
Additions to finance receivables................................. —(14,046,532) (7,343,474) — (118,988) (62,206)
Collection of and proceeds from sale
of finance receivables................................................. —12,776,507 6,236,582 — 108,230 52,830
Additions to fixed assets
excluding equipment leased to others..................... (1,414,468) (11,346) (1,425,814) (11,982) (96) (12,078)
Additions to equipment leased to others .................. (153,163) (1,256,840) (1,410,003) (1,297) (10,647) (11,944)
Proceeds from sales of fixed assets
excluding equipment leased to others..................... 56,040 8,381 64,421 475 71 546
Proceeds from sales of equipment
leased to others .......................................................... 107,270 252,653 359,923 909 2,140 3,049
Purchases of marketable securities
and security investments............................................ (889,008) (179,197) (1,068,205) (7,531) (1,518) (9,049)
Proceeds from sales of and maturity of
marketable securities and security investments ...... 708,130 117,041 825,171 5,998 991 6,989
Payment for additional investments
in affiliated companies, net of cash acquired .......... (1,651) — (1,651) (14) — (14)
Changes in investments and other assets,
and other..................................................................... (21,751) 15,250 (51,328) (185) 130 (435)
Net cash used in investing activities .................. (1,608,601) (2,324,083) (3,814,378) (13,627) (19,687) (32,312)
Cash flows from financing activities
Purchase of common stock.......................................... (295,699) — (295,699) (2,505) — (2,505)
Proceeds from issuance of long-term debt................ 31,509 2,897,028 2,890,000 267 24,541 24,481
Payments of long-term debt........................................ (41,833) (1,694,407) (1,726,823) (354) (14,353) (14,628)
Increase (decrease) in short-term borrowings............ (83,651) 362,078 353,397 (709) 3,067 2,994
Dividends paid.............................................................. (339,107) — (339,107) (2,873) — (2,873)
Net cash provided by (used in)
financing activities ............................................. (728,781) 1,564,699 881,768 (6,174) 13,255 7,469
Effect of exchange rate changes on cash
and cash equivalents ...................................................... 21,995 3,434 25,429 187 29 216
Net increase in cash and cash equivalents ..................... 296,700 34,292 330,992 2,513 291 2,804
Cash and cash equivalents at beginning of year ........... 1,418,022 151,365 1,569,387 12,012 1,282 13,294
Cash and cash equivalents at end of year ...................... ¥ 1,714,722 ¥ 185,657 ¥ 1,900,379 $ 14,525 $ 1,573 $ 16,098