Toyota 2007 Annual Report Download - page 110
Download and view the complete annual report
Please find page 110 of the 2007 Toyota annual report below. You can navigate through the pages in the report by either clicking on the pages listed below, or by using the keyword search tool below to find specific information within the annual report.-
 1
1 -
2
-
3
-
4
-
5
-
6
-
7
-
8
-
9
-
10
-
11
-
12
-
13
-
14
-
15
-
16
-
17
-
18
-
19
-
20
-
21
-
22
-
23
-
24
-
25
-
26
-
27
-
28
-
29
-
30
-
31
-
32
-
33
-
34
-
35
-
36
-
37
-
38
-
39
-
40
-
41
-
42
-
43
-
44
-
45
-
46
-
47
-
48
-
49
-
50
-
51
-
52
-
53
-
54
-
55
-
56
-
57
-
58
-
59
-
60
-
61
-
62
-
63
-
64
-
65
-
66
-
67
-
68
-
69
-
70
-
71
-
72
-
73
-
74
-
75
-
76
-
77
-
78
-
79
-
80
-
81
-
82
-
83
-
84
-
85
-
86
-
87
-
88
-
89
-
90
-
91
-
92
-
93
-
94
-
95
-
96
-
97
-
98
-
99
-
 100
100 -
 101
101 -
 102
102 -
 103
103 -
 104
104 -
 105
105 -
 106
106 -
 107
107 -
 108
108 -
 109
109 -
 110
110 -
 111
111 -
 112
112 -
 113
113 -
 114
114 -
 115
115 -
 116
116 -
 117
117 -
 118
118 -
 119
119 -
 120
120 -
121
-
122
-
123
-
124
-
125
-
126
-
127
-
128
-
129
-
130
-
131
-
132
-
133
-
134
-
135
-
136
-
137
-
138
-
139
-
140
 |
 |
108 ANNUAL REPORT 2007
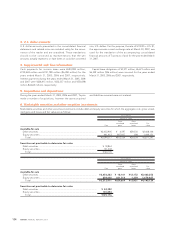
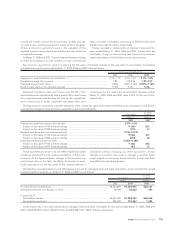
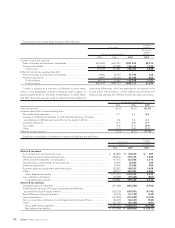
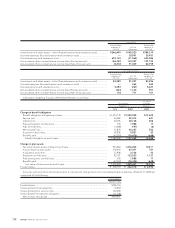
Other receivables relate to arrangements with certain component manufacturers whereby Toyota procures inventory for these com-
ponent manufacturers and is reimbursed for the related purchases.
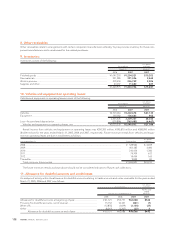
8. Other receivables:
Inventories consist of the following:
U.S. dollars
Yen in millions in millions
March 31, March 31,
2006 2007 2007
Finished goods ...................................................................................................................... ¥1,097,203 ¥1,204,521 $10,203
Raw materials ......................................................................................................................... 221,285 291,006 2,465
Work in process ..................................................................................................................... 239,450 236,749 2,006
Supplies and other................................................................................................................. 63,037 71,680 607
¥1,620,975 ¥1,803,956 $15,281
9. Inventories:
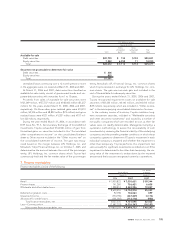
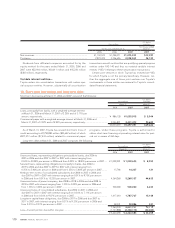
Vehicles and equipment on operating leases consist of the following:
U.S. dollars
Yen in millions in millions
March 31, March 31,
2006 2007 2007
Vehicles................................................................................................................................... ¥2,503,064 ¥3,202,674 $27,130
Equipment.............................................................................................................................. 102,362 106,663 903
2,605,426 3,309,337 28,033
Less—Accumulated depreciation ........................................................................................ (579,896) (763,485) (6,467)
Vehicles and equipment on operating leases, net ......................................................... ¥2,025,530 ¥2,545,852 $21,566
10. Vehicles and equipment on operating leases:
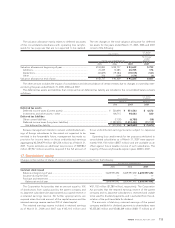
Rental income from vehicles and equipment on operating leases was ¥291,205 million, ¥395,870 million and ¥508,095 million
($4,304 million) for the years ended March 31, 2005, 2006 and 2007, respectively. Future minimum rentals from vehicles and equip-
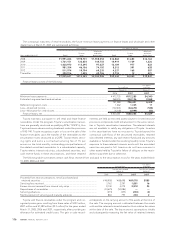
ment on operating leases are due in installments as follows:
U.S. dollars
Year ending March 31, Yen in millions in millions
2008 ............................................................................................................................................................... ¥ 549,940 $ 4,659
2009 ............................................................................................................................................................... 401,385 3,400
2010 ............................................................................................................................................................... 210,476 1,783
2011 ............................................................................................................................................................... 74,709 633
2012 ............................................................................................................................................................... 19,454 165
Thereafter...................................................................................................................................................... 9,859 83
Total minimum future rentals .................................................................................................................. ¥1,265,823 $10,723
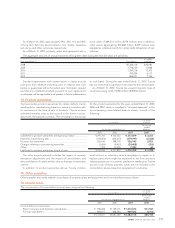
The future minimum rentals as shown above should not be considered indicative of future cash collections.
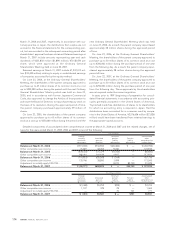
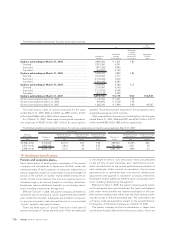
An analysis of activity within the allowance for doubtful accounts relating to trade accounts and notes receivable for the years ended
March 31, 2005, 2006 and 2007 is as follows:
U.S. dollars
Yen in millions in millions
For the year
ended
For the years ended March 31, March 31,
2005 2006 2007 2007
Allowance for doubtful accounts at beginning of year..................................... ¥ 61,121 ¥55,751 ¥62,088 $526
Provision for doubtful accounts, net of reversal................................................ 15,752 10,361 (841) (7)
Write-offs .............................................................................................................. (12,855)(1,819) (3,154) (27)
Other..................................................................................................................... (8,267) (2,205) (27) 0
Allowance for doubtful accounts at end of year ................................... ¥ 55,751 ¥62,088 ¥58,066 $492
11. Allowance for doubtful accounts and credit losses: