Toyota 2007 Annual Report Download - page 18
Download and view the complete annual report
Please find page 18 of the 2007 Toyota annual report below. You can navigate through the pages in the report by either clicking on the pages listed below, or by using the keyword search tool below to find specific information within the annual report.-
 1
1 -
2
-
3
-
4
-
5
-
6
-
7
-
 8
8 -
 9
9 -
 10
10 -
 11
11 -
 12
12 -
 13
13 -
 14
14 -
 15
15 -
 16
16 -
 17
17 -
 18
18 -
 19
19 -
 20
20 -
 21
21 -
 22
22 -
 23
23 -
 24
24 -
 25
25 -
 26
26 -
 27
27 -
 28
28 -
29
-
30
-
31
-
32
-
33
-
34
-
35
-
36
-
37
-
38
-
39
-
40
-
41
-
42
-
43
-
44
-
45
-
46
-
47
-
48
-
49
-
50
-
51
-
52
-
53
-
54
-
55
-
56
-
57
-
58
-
59
-
60
-
61
-
62
-
63
-
64
-
65
-
66
-
67
-
68
-
69
-
70
-
71
-
72
-
73
-
74
-
75
-
76
-
77
-
78
-
79
-
80
-
81
-
82
-
83
-
84
-
85
-
86
-
87
-
88
-
89
-
90
-
91
-
92
-
93
-
94
-
95
-
96
-
97
-
98
-
99
-
100
-
101
-
102
-
103
-
104
-
105
-
106
-
107
-
108
-
109
-
110
-
111
-
112
-
113
-
114
-
115
-
116
-
117
-
118
-
119
-
120
-
121
-
122
-
123
-
124
-
125
-
126
-
127
-
128
-
129
-
130
-
131
-
132
-
133
-
134
-
135
-
136
-
137
-
138
-
139
-
140
 |
 |
16 ANNUAL REPORT 2007
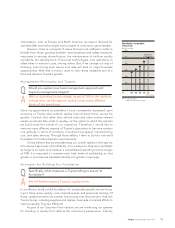
■Fiscal 2007 Business Results
1. Performance Overview
In the fiscal year ended March 31, 2007, Toyota posted record business
results across the board. On a consolidated basis, Toyota achieved a
year-on-year increase of 550,000 units in vehicle sales, to 8,524,000
vehicles; a 13.8% increase in net revenues, to ¥23,948.0 billion; a 19.2%
increase in operating income, to ¥2,238.6 billion; and a 19.8% increase
in net income, to ¥1,644.0 billion.
Due to various factors contributing a total of ¥720.0 billion to income,
which offset expenses associated with operational expansion of ¥359.7
billion, operating income increased ¥360.3 billion and surpassed ¥2
trillion for the first time. Factors that contributed to increased income
were sales efforts (¥330.0 billion), cost reductions (¥100.0 billion), and
the effect of changes in currency exchange rates (¥290.0 billion).
In fiscal 2007, we were able to advance the development of
technologies and products for the future while achieving a large increase
in earnings, which resulted from increased vehicle sales through
favorable overseas sales and cost reductions and other factors. Also, we
believe that we have managed to move toward a more globally balanced
earnings structure by growing earnings in Europe and Central and
South America. Toyota will continue to build a rock-solid base through
the improvement of technology, supply, and marketing and their
supporting factors: product quality, cost, and human resources. Toyota
will continue to work toward stable, long-term growth by taking in
opportunities while avoiding or absorbing risks in all product segments
and regions.
2. Geographic Segment Information
In Japan, earnings were significantly higher, with a 13.0% increase in net
revenues, to ¥14,815.3 billion, and a 35.4% rise in operating income, to
¥1,457.2 billion. Earnings were up due to a significant increase in vehicle
exports resulting from Toyota’s raising of domestic production capacity
in the previous fiscal year to meet heavier overseas demand.
In North America, net revenues increased 17.5%, to ¥9,029.7
billion, while operating income decreased 9.3%, to ¥449.6 billion.
Despite incurring temporary expenses related to the start-up of the
Texas plant, Toyota maintained high income levels due to strong sales
of such new models as the RAV4, Camry, FJ Cruiser, and Yaris.
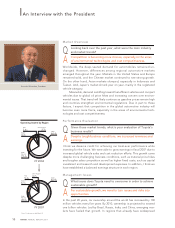
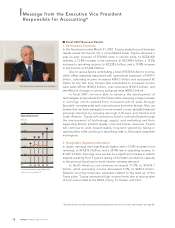
Message from the Executive Vice President
Responsible for Accounting*
Mitsuo Kinoshita, Executive Vice President
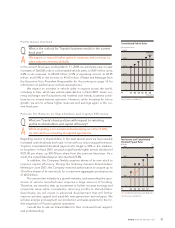
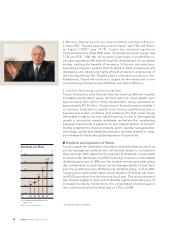
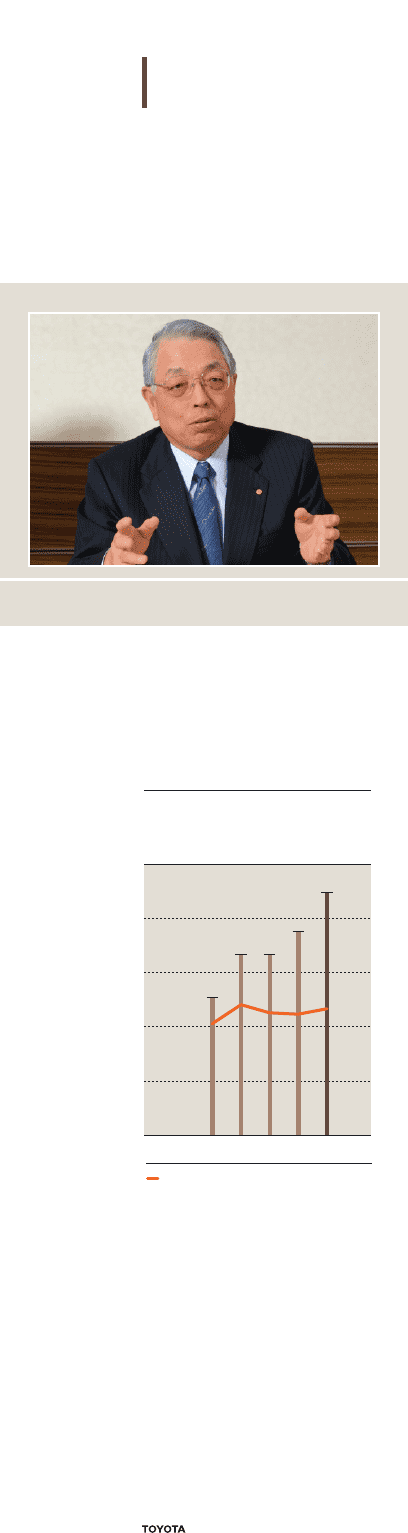
2,500 20
1,500 12
1,000 8
500 4
2,000 16
00
Operating Income
(¥ Billion) (%)
FY ’04’03 ’05 ’06 ’07
Operating income margin (Right scale)
Note: Fiscal years ended March 31
* Responsibilities include accounting related operational areas (see Directors and Auditors on page 54)