Toyota 2007 Annual Report Download - page 72
Download and view the complete annual report
Please find page 72 of the 2007 Toyota annual report below. You can navigate through the pages in the report by either clicking on the pages listed below, or by using the keyword search tool below to find specific information within the annual report.-
 1
1 -
2
-
3
-
4
-
5
-
6
-
7
-
8
-
9
-
10
-
11
-
12
-
13
-
14
-
15
-
16
-
17
-
18
-
19
-
20
-
21
-
22
-
23
-
24
-
25
-
26
-
27
-
28
-
29
-
30
-
31
-
32
-
33
-
34
-
35
-
36
-
37
-
38
-
39
-
40
-
41
-
42
-
43
-
44
-
45
-
46
-
47
-
48
-
49
-
50
-
51
-
52
-
53
-
54
-
55
-
56
-
57
-
58
-
59
-
60
-
61
-
 62
62 -
 63
63 -
 64
64 -
 65
65 -
 66
66 -
 67
67 -
 68
68 -
 69
69 -
 70
70 -
 71
71 -
 72
72 -
 73
73 -
 74
74 -
 75
75 -
 76
76 -
 77
77 -
 78
78 -
 79
79 -
 80
80 -
 81
81 -
 82
82 -
83
-
84
-
85
-
86
-
87
-
88
-
89
-
90
-
91
-
92
-
93
-
94
-
95
-
96
-
97
-
98
-
99
-
100
-
101
-
102
-
103
-
104
-
105
-
106
-
107
-
108
-
109
-
110
-
111
-
112
-
113
-
114
-
115
-
116
-
117
-
118
-
119
-
120
-
121
-
122
-
123
-
124
-
125
-
126
-
127
-
128
-
129
-
130
-
131
-
132
-
133
-
134
-
135
-
136
-
137
-
138
-
139
-
140
 |
 |

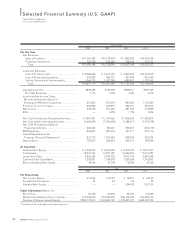
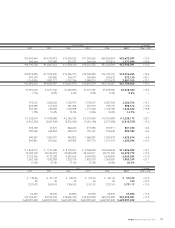
70 ANNUAL REPORT 2007
Yen in millions
1998 1999 2000 2001
For the Year:
Net Revenues:
Sales of Products.................................................. ¥11,160,345 ¥12,174,404 ¥11,892,900 ¥12,402,104
Financing Operations .......................................... 525,799 583,692 528,349 553,133
Total .................................................................. ¥11,686,144 ¥12,758,096 ¥12,421,249 ¥12,955,237
Costs and Expenses:
Cost of Products Sold.......................................... ¥ 8,888,646 ¥ 9,613,707 ¥ 9,839,833 ¥10,218,599
Cost of Financing Operations............................. 402,298 456,781 401,998 427,340
Selling, General and Administrative................... 1,566,175 1,937,200 1,480,857 1,518,569
Total .................................................................. ¥10,857,119 ¥12,007,688 ¥11,722,688 ¥12,164,508
Operating Income ................................................... ¥829,025 ¥750,408 ¥698,561 ¥790,729
% of Net Revenues .............................................. 7.1% 5.9% 5.6% 6.1%
Income before Income Taxes,
Minority Interest and Equity in
Earnings of Affiliated Companies ........................ 873,065 875,674 880,680 1,107,289
Provision for Income Taxes..................................... 458,906 425,851 422,731 523,876
Net Income .............................................................. 436,935 451,646 481,936 674,898
ROE........................................................................... — 6.8% 7.1% 9.6%
Net Cash Provided by Operating Activities .......... ¥ 1,047,401 ¥ 1,741,966 ¥ 1,098,925 ¥ 1,428,018
Net Cash Used in Investing Activities .................... (1,646,507) (1,936,028) (1,388,517) (1,318,738)
Net Cash Provided by (Used in)
Financing Activities................................................ 268,623 330,621 550,267 (166,713)
R&D Expenses.......................................................... 444,401 487,334 451,177 475,716
Capital Expenditures for
Property, Plant and Equipment* .......................... 812,719 1,016,482 838,309 762,274
Depreciation ............................................................ 759,217 864,224 822,315 784,784
At Year-End:
Shareholders’ Equity ............................................... ¥ 6,544,937 ¥ 6,655,283 ¥ 6,912,140 ¥ 7,077,411
Total Assets.............................................................. 14,822,143 15,879,185 16,440,960 17,019,783
Long-Term Debt ...................................................... 2,802,224 2,997,725 2,913,759 3,083,344
Cash and Cash Equivalents..................................... 1,226,507 1,334,058 1,529,268 1,510,892
Ratio of Shareholders’ Equity ................................. 44.2% 41.9% 42.0% 41.6%
Yen
1998 1999 2000 2001
Per Share Data:
Net Income (Basic)................................................... ¥114.86 ¥119.47 ¥ 128.27 ¥ 180.65
Annual Cash Dividends ........................................... 23 23 24 25
Shareholders’ Equity ............................................... — — 1,844.02 1,921.29
Stock Information (March 31):
Stock Price................................................................ ¥3,550 ¥3,430 ¥5,370 ¥4,350
Market Capitalization (Yen in millions)................... ¥13,504,810 ¥12,899,030 ¥20,134,306 ¥16,029,739
Number of Shares Issued (shares).......................... 3,804,172,073 3,760,650,129 3,749,405,129 3,684,997,492
* Excluding vehicles and equipment on operating leases
Selected Financial Summary (U.S. GAAP)
Toyota Motor Corporation
Fiscal years ended March 31