Toyota 2007 Annual Report Download - page 132
Download and view the complete annual report
Please find page 132 of the 2007 Toyota annual report below. You can navigate through the pages in the report by either clicking on the pages listed below, or by using the keyword search tool below to find specific information within the annual report.-
 1
1 -
2
-
3
-
4
-
5
-
6
-
7
-
8
-
9
-
10
-
11
-
12
-
13
-
14
-
15
-
16
-
17
-
18
-
19
-
20
-
21
-
22
-
23
-
24
-
25
-
26
-
27
-
28
-
29
-
30
-
31
-
32
-
33
-
34
-
35
-
36
-
37
-
38
-
39
-
40
-
41
-
42
-
43
-
44
-
45
-
46
-
47
-
48
-
49
-
50
-
51
-
52
-
53
-
54
-
55
-
56
-
57
-
58
-
59
-
60
-
61
-
62
-
63
-
64
-
65
-
66
-
67
-
68
-
69
-
70
-
71
-
72
-
73
-
74
-
75
-
76
-
77
-
78
-
79
-
80
-
81
-
82
-
83
-
84
-
85
-
86
-
87
-
88
-
89
-
90
-
91
-
92
-
93
-
94
-
95
-
96
-
97
-
98
-
99
-
100
-
101
-
102
-
103
-
104
-
105
-
106
-
107
-
108
-
109
-
110
-
111
-
112
-
113
-
114
-
115
-
116
-
117
-
118
-
119
-
120
-
121
-
 122
122 -
 123
123 -
 124
124 -
 125
125 -
 126
126 -
 127
127 -
 128
128 -
 129
129 -
 130
130 -
 131
131 -
 132
132 -
 133
133 -
 134
134 -
 135
135 -
 136
136 -
 137
137 -
 138
138 -
 139
139 -
 140
140
 |
 |

130 ANNUAL REPORT 2007
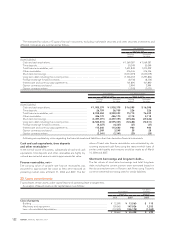
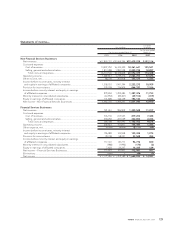
Statements of cash flows—
Yen in millions Yen in millions
For the year ended March 31, 2005 For the year ended March 31, 2006
Non-Financial Financial Non-Financial Financial
Services Services Services Services
Businesses Businesses Consolidated Businesses Businesses Consolidated
Cash flows from operating activities
Net income .................................................................. ¥ 1,047,741 ¥ 123,975 ¥ 1,171,260 ¥ 1,264,223 ¥ 107,952 ¥ 1,372,180
Adjustments to reconcile net income to net cash
provided by operating activities
Depreciation............................................................ 777,129 220,584 997,713 909,444 301,734 1,211,178
Provision for doubtful accounts
and credit losses ................................................... 15,752 47,402 63,154 10,361 52,285 62,646
Pension and severance costs, less payments....... (53,401) 468 (52,933) 22,664 1,196 23,860
Losses on disposal of fixed assets......................... 48,334 825 49,159 54,614 367 54,981
Unrealized losses on available-for-sale
securities, net ........................................................ 2,324 — 2,324 4,163 — 4,163
Deferred income taxes........................................... 29,398 54,860 84,711 31,370 1,889 33,262
Minority interest in consolidated subsidiaries...... 63,952 988 64,938 82,401 1,992 84,393
Equity in earnings of affiliated companies ........... (131,849) (7,622) (139,471) (142,139) (22,227) (164,366)
Changes in operating assets and liabilities,
and other ............................................................... (97,535) 203,762 130,085 (214,507) 138,766 (166,817)
Net cash provided by operating activities ....... 1,701,845 645,242 2,370,940 2,022,594 583,954 2,515,480
Cash flows from investing activities
Additions to finance receivables ............................... — (9,562,203) (5,594,375) — (11,407,390) (6,476,979)
Collection of and proceeds
from sale of finance receivables .............................. — 8,586,796 4,674,919 — 10,545,425 5,718,130
Additions to fixed assets
excluding equipment leased to others ................... (1,049,572) (18,715) (1,068,287) (1,516,658) (6,801) (1,523,459)
Additions to equipment leased to others................. (146,891) (708,062) (854,953) (144,391) (1,103,390) (1,247,781)
Proceeds from sales of fixed assets
excluding equipment leased to others ................... 60,034 9,362 69,396 81,950 7,628 89,578
Proceeds from sales of equipment
leased to others......................................................... 84,450 232,006 316,456 112,692 297,991 410,683
Purchases of marketable securities
and security investments .......................................... (1,053,417) (112,374) (1,165,791) (764,016) (193,280) (957,296)
Proceeds from sales of and maturity of
marketable securities and security investments..... 471,614 102,329 573,943 561,948 129,084 691,032
Payment for additional investments
in affiliated companies, net of cash acquired......... (901) — (901) (1,802) — (1,802)
Changes in investments and other assets,
and other ................................................................... 84,979 (16,485) (11,603) (3,292) (83,104) (77,606)
Net cash used in investing activities................. (1,549,704) (1,487,346) (3,061,196) (1,673,569) (1,813,837) (3,375,500)
Cash flows from financing activities
Purchase of common stock ........................................ (264,106) — (264,106) (129,629) — (129,629)
Proceeds from issuance of long-term debt .............. 27,363 1,862,012 1,863,710 33,904 1,930,823 1,928,788
Payments of long-term debt ...................................... (59,689) (1,160,710) (1,155,223) (59,778) (1,233,336) (1,187,506)
Increase in short-term borrowings............................. 564 178,956 140,302 86,731 513,602 509,826
Dividends paid ............................................................ (165,299) — (165,299) (244,568) — (244,568)
Other ............................................................................ (7,000) 7,000 — — — —
Net cash provided by (used in)
financing activities............................................ (468,167) 887,258 419,384 (313,340) 1,211,089 876,911
Effect of exchange rate changes on cash
and cash equivalents..................................................... 21,276 3,573 24,849 58,211 10,532 68,743
Net increase (decrease) in cash
and cash equivalents..................................................... (294,750) 48,727 (246,023) 93,896 (8,262) 85,634
Cash and cash equivalents at beginning of year .......... 1,618,876 110,900 1,729,776 1,324,126 159,627 1,483,753
Cash and cash equivalents at end of year..................... ¥ 1,324,126 ¥ 159,627 ¥ 1,483,753 ¥ 1,418,022 ¥ 151,365 ¥ 1,569,387