Toyota 2007 Annual Report Download - page 78
Download and view the complete annual report
Please find page 78 of the 2007 Toyota annual report below. You can navigate through the pages in the report by either clicking on the pages listed below, or by using the keyword search tool below to find specific information within the annual report.-
 1
1 -
2
-
3
-
4
-
5
-
6
-
7
-
8
-
9
-
10
-
11
-
12
-
13
-
14
-
15
-
16
-
17
-
18
-
19
-
20
-
21
-
22
-
23
-
24
-
25
-
26
-
27
-
28
-
29
-
30
-
31
-
32
-
33
-
34
-
35
-
36
-
37
-
38
-
39
-
40
-
41
-
42
-
43
-
44
-
45
-
46
-
47
-
48
-
49
-
50
-
51
-
52
-
53
-
54
-
55
-
56
-
57
-
58
-
59
-
60
-
61
-
62
-
63
-
64
-
65
-
66
-
67
-
 68
68 -
 69
69 -
 70
70 -
 71
71 -
 72
72 -
 73
73 -
 74
74 -
 75
75 -
 76
76 -
 77
77 -
 78
78 -
 79
79 -
 80
80 -
 81
81 -
 82
82 -
 83
83 -
 84
84 -
 85
85 -
 86
86 -
 87
87 -
 88
88 -
89
-
90
-
91
-
92
-
93
-
94
-
95
-
96
-
97
-
98
-
99
-
100
-
101
-
102
-
103
-
104
-
105
-
106
-
107
-
108
-
109
-
110
-
111
-
112
-
113
-
114
-
115
-
116
-
117
-
118
-
119
-
120
-
121
-
122
-
123
-
124
-
125
-
126
-
127
-
128
-
129
-
130
-
131
-
132
-
133
-
134
-
135
-
136
-
137
-
138
-
139
-
140
 |
 |
76 ANNUAL REPORT 2007
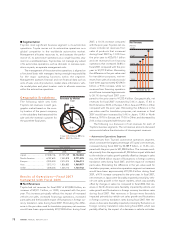
Toyota continues to originate leases to finance new Toyota
vehicles. These leasing activities are subject to residual value risk.
Residual value risk could arise when the lessee of a vehicle does
not exercise the option to purchase the vehicle at the end of the
lease term. The number of vehicles returned at the end of leases
term has decreased in recent years. For example, approximately
20% of vehicles leased by Toyota Motor Credit Corporation,
Toyota’s financing subsidiary located in the United States, were
returned at the end of the applicable lease periods during fiscal
2007, which represents a continuing decrease in the return rates
of approximately 40% and 30% in fiscal 2005 and 2006, respec-
tively, due to a narrowing spread between contractual residual
values and end of lease market values. To avoid a loss on a vehi-
cle returned to Toyota at the end of the lease term, Toyota must
resell or re-lease the vehicle at or above the residual value of the
vehicle. If Toyota is unable to recover the residual value of the
vehicle, it will incur a loss at the end of the lease, which may
offset a portion of the earnings on the lease. To the extent that
sales incentives remain an integral part of sales promotions
(reducing new vehicle prices and cost of ownership), resale prices
of used vehicles and, correspondingly, the fair value of Toyota’s
leased vehicles could be subject to downward pressure. During
fiscal 2006 and 2007, losses have decreased mainly due to a
decrease in the number of vehicles returned. See discussion in
the Critical Accounting Estimates section regarding “Investment
in Operating Leases” and note 2 to the consolidated financial
statements regarding the allowance for residual values losses.
Toyota maintains an overall risk management strategy to mit-
igate its exposure to fluctuations in interest rates and currency
exchange rates. Toyota enters into interest rate swap agree-
ments and cross currency interest rate swap agreements to con-
vert its fixed-rate debt to variable-rate functional currency debt.
Toyota formally documents relationships between the derivative
instrument and the hedged item, as well as its risk-management
strategy for undertaking hedge transactions. If Toyota elects fair
value hedge accounting, derivative instruments are designated
with specific liabilities on Toyota’s consolidated balance sheet,
and the fair value quarterly change component of each derivative
instrument and hedged item is included in the assessment of
hedge effectiveness. Most interest rate swap agreements are
executed as an integral part of specific debt transactions, achiev-
ing designated hedges. Toyota uses cross currency interest rate
swap agreements to entirely hedge exposure to currency
exchange rate fluctuations on principal and/or interest payments
and to manage its exposure to interest rate fluctuations. Certain
derivative instruments are entered into to hedge interest rate risk
from an economic perspective and are not designated to specific
assets or liabilities on Toyota’s consolidated balance sheet.
Accordingly, unrealized gains or losses related to derivatives that
are not designated to specific assets and liabilities on Toyota’s
consolidated balance sheet are recognized currently in opera-
tions. As a result, earnings are impacted by these non-designat-
ed derivatives. The impact of recognizing these unrealized gains
and losses attributed to non-designated derivatives resulted in
an increase, decrease, and decrease in net income in fiscal 2005,
2006 and 2007, respectively. Toyota does not use any derivative
instruments for trading purposes. See discussion in the Critical
Accounting Estimates section regarding “Derivatives and Other
Contracts at Fair Value”, and further discussion in the Market Risk
Disclosures section.
In addition, aggregated funding costs can affect the prof-
itability of Toyota’s financial services operations. Funding costs
are affected by a number of factors, some of which are not
in Toyota’s control. These factors include general economic
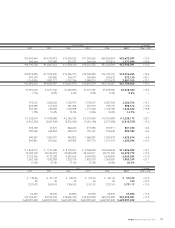
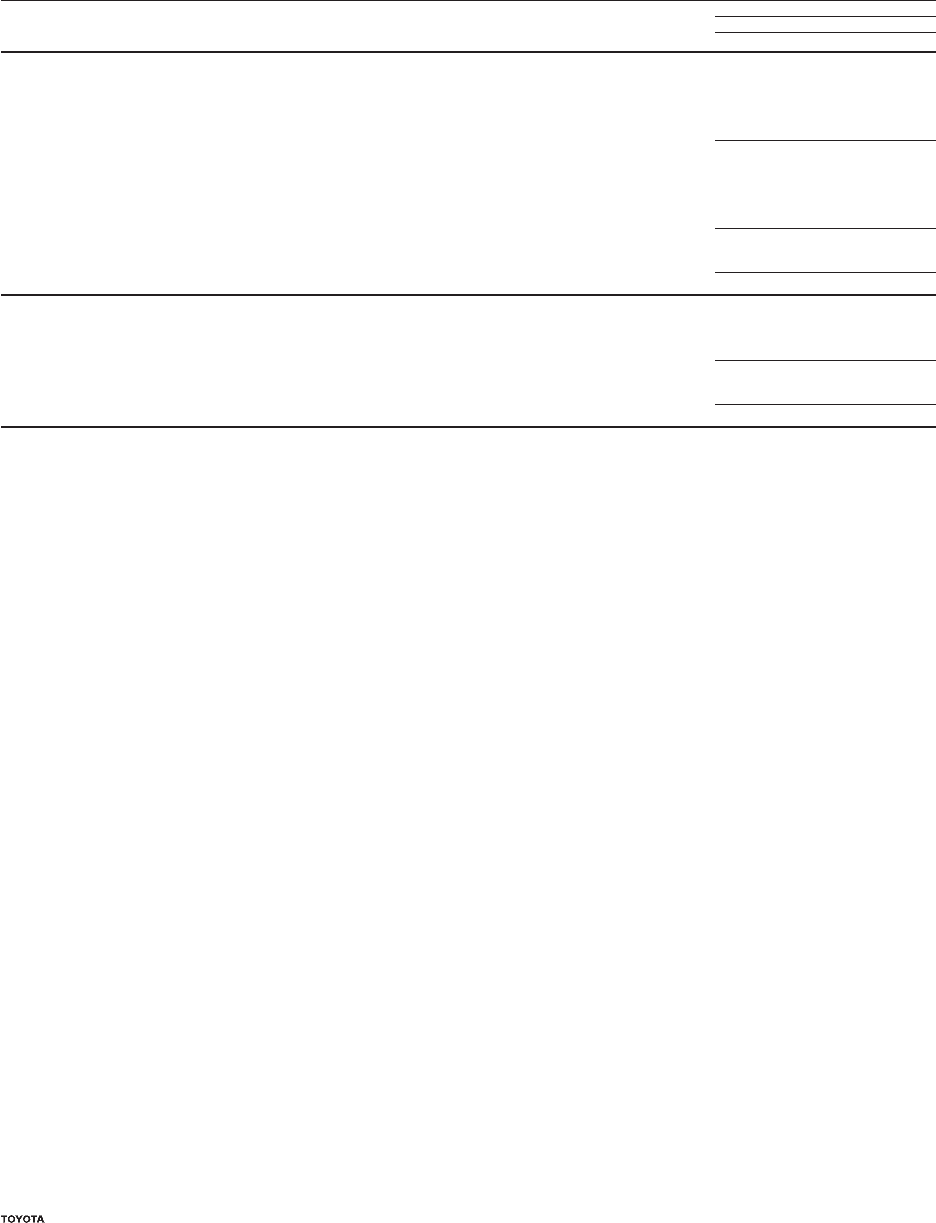
The following table provides information regarding Toyota’s finance receivables and operating leases as of March 31, 2006 and 2007.
Yen in millions
March 31,
2006 2007
Finance Receivables
Retail............................................................................................................................................................................ ¥ 5,930,822 ¥ 7,005,631
Finance leases............................................................................................................................................................. 741,280 756,421
Wholesale and other dealer loans ............................................................................................................................ 1,998,814 2,342,926
8,670,916 10,104,978
Deferred origination costs......................................................................................................................................... 92,798 106,063
Unearned income....................................................................................................................................................... (334,796) (367,829)
Allowance for credit losses........................................................................................................................................ (101,383) (112,116)
Total finance receivables, net ............................................................................................................................... 8,327,535 9,731,096
Less—Current portion............................................................................................................................................... (3,497,319) (4,036,363)
Noncurrent finance receivables, net .................................................................................................................... ¥ 4,830,216 ¥ 5,694,733
Operating Leases
Vehicles ....................................................................................................................................................................... ¥ 2,503,064 ¥ 3,202,674
Equipment .................................................................................................................................................................. 102,362 106,663
2,605,426 3,309,337
Less—Accumulated depreciation ............................................................................................................................ (579,896) (763,485)
Vehicles and equipment on operating leases, net.............................................................................................. ¥ 2,025,530 ¥ 2,545,852