Toyota 2007 Annual Report Download - page 76
Download and view the complete annual report
Please find page 76 of the 2007 Toyota annual report below. You can navigate through the pages in the report by either clicking on the pages listed below, or by using the keyword search tool below to find specific information within the annual report.-
 1
1 -
2
-
3
-
4
-
5
-
6
-
7
-
8
-
9
-
10
-
11
-
12
-
13
-
14
-
15
-
16
-
17
-
18
-
19
-
20
-
21
-
22
-
23
-
24
-
25
-
26
-
27
-
28
-
29
-
30
-
31
-
32
-
33
-
34
-
35
-
36
-
37
-
38
-
39
-
40
-
41
-
42
-
43
-
44
-
45
-
46
-
47
-
48
-
49
-
50
-
51
-
52
-
53
-
54
-
55
-
56
-
57
-
58
-
59
-
60
-
61
-
62
-
63
-
64
-
65
-
 66
66 -
 67
67 -
 68
68 -
 69
69 -
 70
70 -
 71
71 -
 72
72 -
 73
73 -
 74
74 -
 75
75 -
 76
76 -
 77
77 -
 78
78 -
 79
79 -
 80
80 -
 81
81 -
 82
82 -
 83
83 -
 84
84 -
 85
85 -
 86
86 -
87
-
88
-
89
-
90
-
91
-
92
-
93
-
94
-
95
-
96
-
97
-
98
-
99
-
100
-
101
-
102
-
103
-
104
-
105
-
106
-
107
-
108
-
109
-
110
-
111
-
112
-
113
-
114
-
115
-
116
-
117
-
118
-
119
-
120
-
121
-
122
-
123
-
124
-
125
-
126
-
127
-
128
-
129
-
130
-
131
-
132
-
133
-
134
-
135
-
136
-
137
-
138
-
139
-
140
 |
 |
74 ANNUAL REPORT 2007
Management’s Discussion and Analysis
of Financial Condition and Results of Operations
All financial information discussed in this section is
derived from Toyota’s consolidated financial state-
ments that appear elsewhere in this annual report
on Form 20-F. The financial statements have been
prepared in conformity with accounting principles
generally accepted in the United States of America.
Overview
The business segments of Toyota include automotive operations,
financial services operations and all other operations. Automotive
operations is Toyota’s most significant business segment,
accounting for 89% of Toyota’s total revenues before the elimina-
tion of intersegment revenues and 91% of Toyota’s total operat-
ing income before the elimination of intersegment revenues and
costs for the year ended March 31, 2007. The operating income
from automotive operations as a percentage of total operating
income increased by 1% compared with fiscal 2006 due to an
increase in operating income from automotive operations.
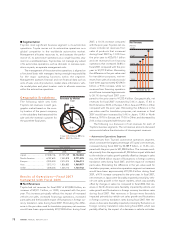
Toyota’s primary markets based on vehicle unit sales for the year
ended March 31, 2007 were: Japan (27%), North America (35%),
Europe (14%), and Asia (9%).
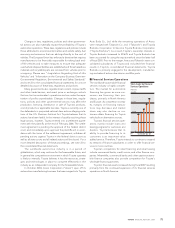
■Automotive Market Environment
The worldwide automotive market is highly competitive and
volatile. The demand for automobiles is affected by a number of
factors including social, political and general economic condi-
tions; introduction of new vehicles and technologies; and costs
incurred by customers to purchase and operate vehicles. These
factors can cause consumer demand to vary substantially from
year to year in different geographic markets and for different
types of automobiles.
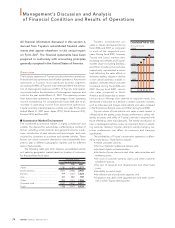
The following table sets forth Toyota’s consolidated vehicle
unit sales by geographic market based on location of customers
for the past three fiscal years.
Thousands of units
Year ended March 31,
2005 2006 2007
Japan ........................................................ 2,381 2,364 2,273
North America ......................................... 2,271 2,556 2,942
Europe...................................................... 979 1,023 1,224
Asia ........................................................... 833 880 789
Other ........................................................ 944 1,151 1,296
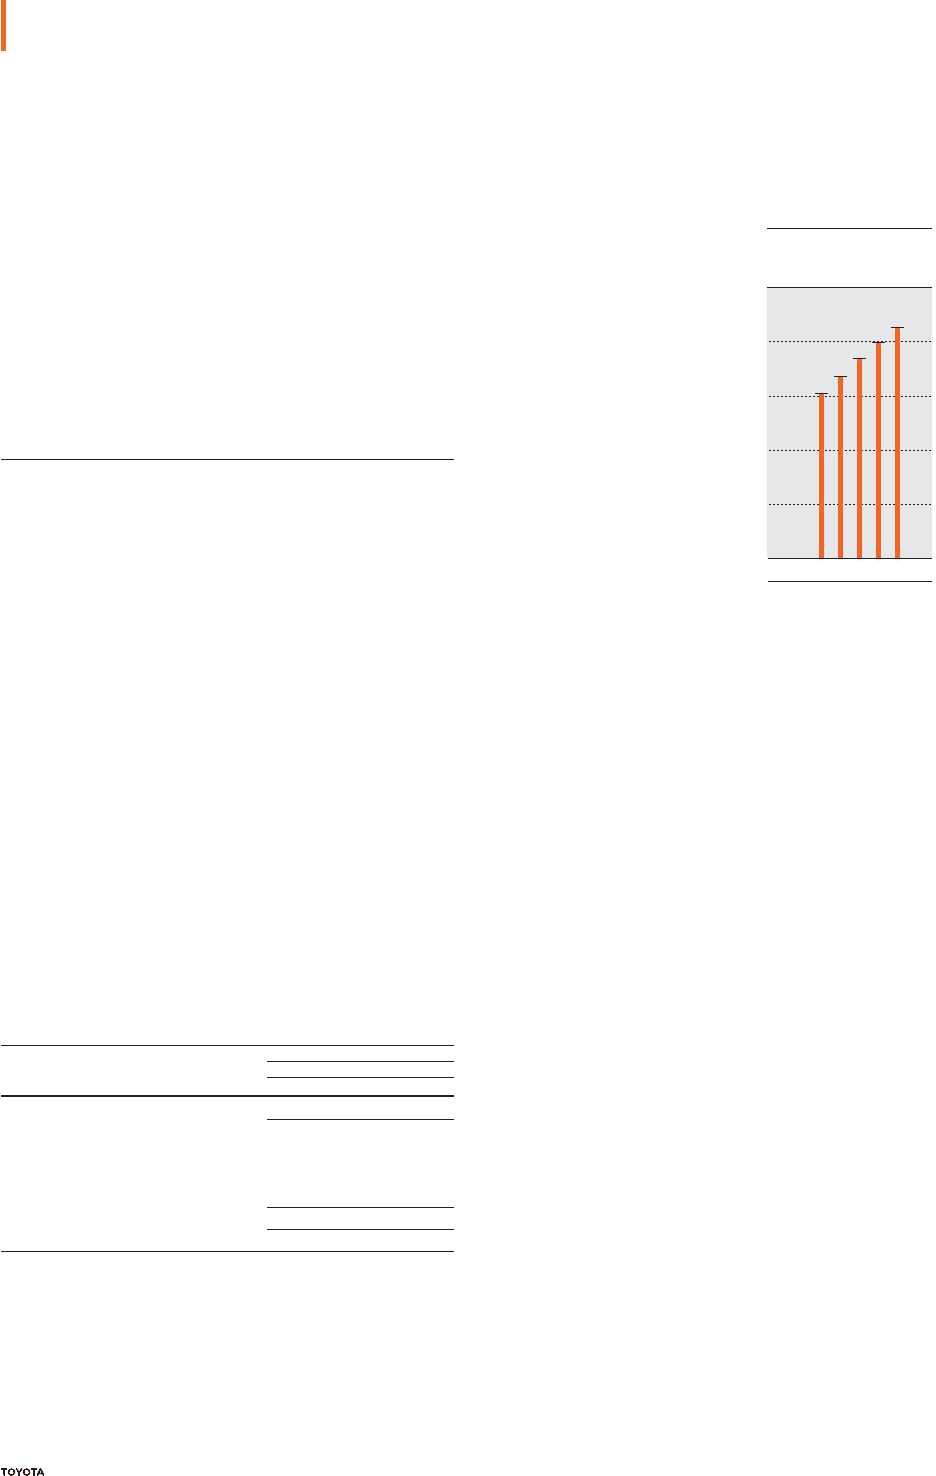
Overseas total.......................................... 5,027 5,610 6,251
Total.......................................................... 7,408 7,974 8,524
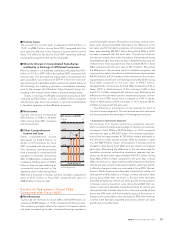
Toyota’s consolidated unit
sales in Japan decreased during
fiscal 2006 and 2007 as compared
to each of the respective prior
years. During fiscal 2007, however,
Toyota and Lexus’ market share
excluding mini-vehicles and Toyota’s
market share (including Daihatsu
and Hino) including mini-vehicles,
respectively, represented a record
high reflecting the sales efforts of
domestic dealers, despite a decline
in the overall domestic market. In
addition, overseas vehicle unit sales
increased during fiscal 2006 and
2007. During fiscal 2007, vehicle
unit sales increased in North
America and Europe due to exten-
sive product offerings that catered to regional needs but
decreased in Asia due to a decline in certain countries’ markets,
such as Indonesia and Taiwan, while vehicle unit sales increased
in North America, Europe, Asia, and Other during fiscal 2006.
Toyota’s share of total vehicle unit sales in each market is
influenced by the quality, price, design, performance, safety, reli-
ability, economy and utility of Toyota’s vehicles compared with
those offered by other manufacturers. The timely introduction of
new or redesigned vehicles is also an important factor in satisfy-
ing customer demand. Toyota’s ability to satisfy changing cus-
tomer preferences can affect its revenues and earnings
significantly.
The profitability of Toyota’s automotive operations is affect-
ed by many factors. These factors include:
• vehicle unit sales volumes,
• the mix of vehicle models and options sold,
• the level of parts and service sales,
• the levels of price discounts and other sales incentives and
marketing costs,
• the cost of customer warranty claims and other customer
satisfaction actions,
• the cost of research and development and other fixed
costs,
• the ability to control costs,
• the efficient use of production capacity, and
• changes in the value of the Japanese yen and other curren-
cies in which Toyota does business.
10,000
6,000
4,000
2,000
8,000
0
Consolidated Vehicle Sales
(Thousands of units)
FY ’04’03 ’05 ’06 ’07