Toyota 2007 Annual Report Download - page 5
Download and view the complete annual report
Please find page 5 of the 2007 Toyota annual report below. You can navigate through the pages in the report by either clicking on the pages listed below, or by using the keyword search tool below to find specific information within the annual report.-
 1
1 -
 2
2 -
 3
3 -
 4
4 -
 5
5 -
 6
6 -
 7
7 -
 8
8 -
 9
9 -
 10
10 -
 11
11 -
 12
12 -
 13
13 -
 14
14 -
 15
15 -
 16
16 -
17
-
18
-
19
-
20
-
21
-
22
-
23
-
24
-
25
-
26
-
27
-
28
-
29
-
30
-
31
-
32
-
33
-
34
-
35
-
36
-
37
-
38
-
39
-
40
-
41
-
42
-
43
-
44
-
45
-
46
-
47
-
48
-
49
-
50
-
51
-
52
-
53
-
54
-
55
-
56
-
57
-
58
-
59
-
60
-
61
-
62
-
63
-
64
-
65
-
66
-
67
-
68
-
69
-
70
-
71
-
72
-
73
-
74
-
75
-
76
-
77
-
78
-
79
-
80
-
81
-
82
-
83
-
84
-
85
-
86
-
87
-
88
-
89
-
90
-
91
-
92
-
93
-
94
-
95
-
96
-
97
-
98
-
99
-
100
-
101
-
102
-
103
-
104
-
105
-
106
-
107
-
108
-
109
-
110
-
111
-
112
-
113
-
114
-
115
-
116
-
117
-
118
-
119
-
120
-
121
-
122
-
123
-
124
-
125
-
126
-
127
-
128
-
129
-
130
-
131
-
132
-
133
-
134
-
135
-
136
-
137
-
138
-
139
-
140
 |
 |
ANNUAL REPORT 2007 3
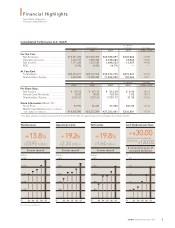
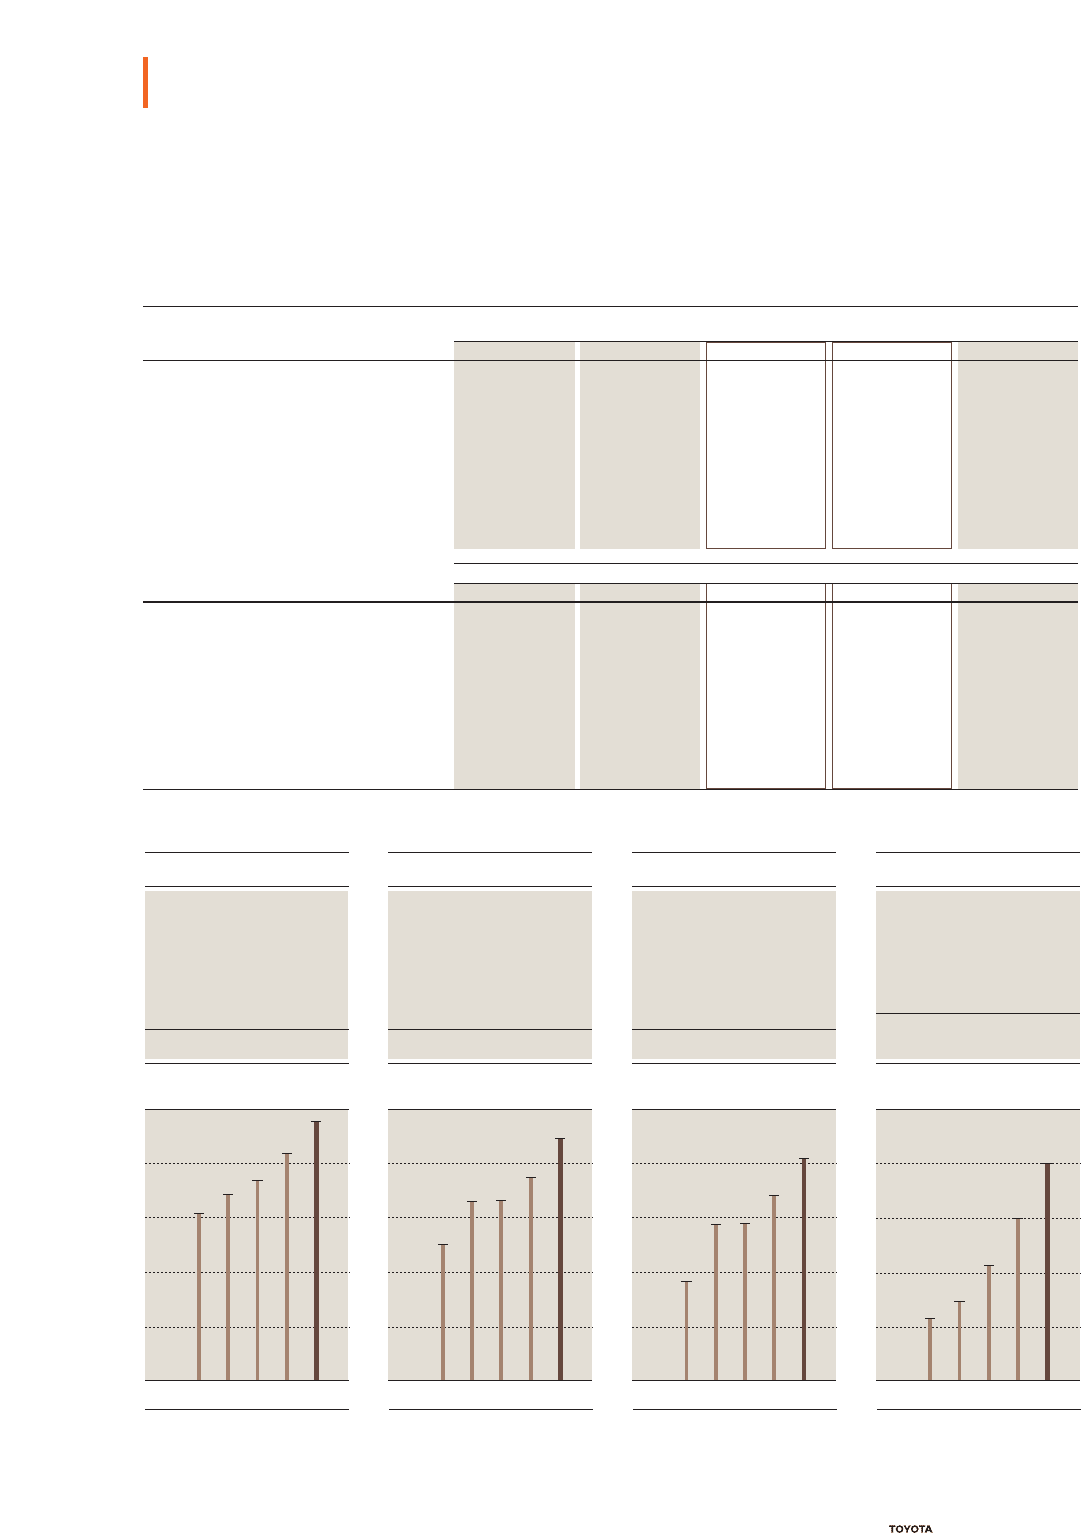
Financial Highlights
Toyota Motor Corporation
Fiscal years ended March 31
U.S. dollars*
Yen in millions in millions % change
2005 2006 2007 2007 2006 vs 2007
For the Year:
Net Revenues....................................... ¥18,551,526 ¥21,036,909 ¥23,948,091 $202,864 +13.8
Operating Income ............................... 1,672,187 1,878,342 2,238,683 18,964 +19.2
Net Income........................................... 1,171,260 1,372,180 1,644,032 13,927 +19.8
ROE....................................................... 13.6% 14.0% 14.7% — —
At Year-End:
Total Assets .......................................... ¥24,335,011 ¥28,731,595 ¥32,574,779 $275,941 +13.4
Shareholders’ Equity............................ 9,044,950 10,560,449 11,836,092 100,263 +12.1
Yen U.S. dollars* % change
2005 2006 2007 2007 2006 vs 2007
Per Share Data:
Net Income........................................... ¥ 355.35 ¥ 421.76 ¥ 512.09 $ 4.34 +21.4
Annual Cash Dividends ....................... 65.00 90.00 120.00 1.02 +33.3
Shareholders’ Equity............................ 2,767.67 3,257.63 3,701.17 31.35 +13.6
Stock Information (March 31):
Stock Price............................................ ¥3,990 ¥6,430 ¥7,550 $63.96 +17.4
Market Capitalization (Yen in millions,
U.S. dollars in millions) ............................ ¥14,403,890 ¥23,212,284 ¥27,255,481 $230,881 +17.4
* U.S. dollar amounts have been translated at the rate of ¥118.05=US$1, the approximate current exchange rate at March 30, 2007.
Consolidated Performance (U.S. GAAP)
15,000
10,000
5,000
20,000
25,000
1,500
1,000
500
2,000
2,500
1,200
800
400
1,600
2,000
90
60
30
120
150
’03 ’04 ’05 ’06 ’07 ’03 ’04 ’05 ’06 ’07 ’03 ’04 ’05 ’06 ’07 ’03 ’04 ’05 ’06 ’07
Note: Fiscal years ended March 31
00 0 0
Net Revenues
(¥ Billion)
FY
(¥ Billion)
FY
(¥ Billion)
FY
(¥)
FY
Operating Income Net Income Cash Dividends per Share
+13.8%
A new record
¥23.95 trillion
+19.2%
A new record
¥2.24 trillion
+19.8%
A new record
¥1.64 trillion¥23.95 trillion ¥2.24 trillion ¥1. 64 trillion
+¥30.00
8 consecutive years of
increased dividends
¥120.00
Annual Cash Dividends
per Share ¥120.00
Annual Cash Dividends
per Share