Toyota 2007 Annual Report Download - page 96
Download and view the complete annual report
Please find page 96 of the 2007 Toyota annual report below. You can navigate through the pages in the report by either clicking on the pages listed below, or by using the keyword search tool below to find specific information within the annual report.-
 1
1 -
2
-
3
-
4
-
5
-
6
-
7
-
8
-
9
-
10
-
11
-
12
-
13
-
14
-
15
-
16
-
17
-
18
-
19
-
20
-
21
-
22
-
23
-
24
-
25
-
26
-
27
-
28
-
29
-
30
-
31
-
32
-
33
-
34
-
35
-
36
-
37
-
38
-
39
-
40
-
41
-
42
-
43
-
44
-
45
-
46
-
47
-
48
-
49
-
50
-
51
-
52
-
53
-
54
-
55
-
56
-
57
-
58
-
59
-
60
-
61
-
62
-
63
-
64
-
65
-
66
-
67
-
68
-
69
-
70
-
71
-
72
-
73
-
74
-
75
-
76
-
77
-
78
-
79
-
80
-
81
-
82
-
83
-
84
-
85
-
 86
86 -
 87
87 -
 88
88 -
 89
89 -
 90
90 -
 91
91 -
 92
92 -
 93
93 -
 94
94 -
 95
95 -
 96
96 -
 97
97 -
 98
98 -
 99
99 -
 100
100 -
 101
101 -
 102
102 -
 103
103 -
 104
104 -
 105
105 -
 106
106 -
107
-
108
-
109
-
110
-
111
-
112
-
113
-
114
-
115
-
116
-
117
-
118
-
119
-
120
-
121
-
122
-
123
-
124
-
125
-
126
-
127
-
128
-
129
-
130
-
131
-
132
-
133
-
134
-
135
-
136
-
137
-
138
-
139
-
140
 |
 |

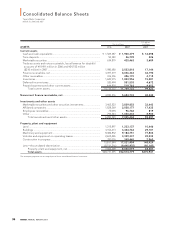
94 ANNUAL REPORT 200794 ANNUAL REPORT 2007
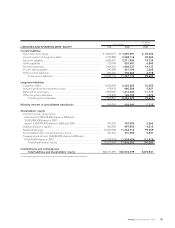
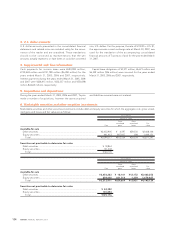
U.S. dollars
Yen in millions in millions
ASSETS 2006 2007 2007
Current assets
Cash and cash equivalents ........................................................................ ¥ 1,569,387 ¥ 1,900,379 $ 16,098
Time deposits ............................................................................................. 50,349 26,709 226
Marketable securities................................................................................. 634,879 435,463 3,689
Trade accounts and notes receivable, less allowance for doubtful
accounts of ¥19,491 million in 2006 and ¥24,782 million
($210 million) in 2007................................................................................ 1,980,680 2,023,818 17,144
Finance receivables, net ............................................................................ 3,497,319 4,036,363 34,192
Other receivables ....................................................................................... 416,336 486,170 4,118
Inventories................................................................................................... 1,620,975 1,803,956 15,281
Deferred income taxes .............................................................................. 520,494 551,503 4,672
Prepaid expenses and other current assets............................................. 444,803 519,762 4,403
Total current assets............................................................................. 10,735,222 11,784,123 99,823
Noncurrent finance receivables, net......................................................... 4,830,216 5,694,733 48,240
Investments and other assets
Marketable securities and other securities investments ......................... 3,402,523 3,829,852 32,443
Affiliated companies .................................................................................. 1,828,369 2,058,177 17,435
Employees receivables .............................................................................. 75,094 96,742 819
Other ........................................................................................................... 793,543 1,050,633 8,900
Total investments and other assets................................................... 6,099,529 7,035,404 59,597
Property, plant and equipment
Land............................................................................................................. 1,215,897 1,233,137 10,446
Buildings ..................................................................................................... 3,156,613 3,444,764 29,181
Machinery and equipment ........................................................................ 8,482,832 9,184,751 77,804
Vehicles and equipment on operating leases ......................................... 2,605,426 3,309,337 28,033
Construction in progress ........................................................................... 397,076 349,465 2,960
15,857,844 17,521,454 148,424
Less—Accumulated depreciation............................................................. (8,791,216) (9,460,935) (80,143)
Property, plant and equipment, net.................................................. 7,066,628 8,060,519 68,281
Total assets......................................................................................... ¥28,731,595 ¥32,574,779 $275,941
The accompanying notes are an integral part of these consolidated financial statements.
Consolidated Balance Sheets
Toyota Motor Corporation
March 31, 2006 and 2007