Toyota 2007 Annual Report Download - page 84
Download and view the complete annual report
Please find page 84 of the 2007 Toyota annual report below. You can navigate through the pages in the report by either clicking on the pages listed below, or by using the keyword search tool below to find specific information within the annual report.-
 1
1 -
2
-
3
-
4
-
5
-
6
-
7
-
8
-
9
-
10
-
11
-
12
-
13
-
14
-
15
-
16
-
17
-
18
-
19
-
20
-
21
-
22
-
23
-
24
-
25
-
26
-
27
-
28
-
29
-
30
-
31
-
32
-
33
-
34
-
35
-
36
-
37
-
38
-
39
-
40
-
41
-
42
-
43
-
44
-
45
-
46
-
47
-
48
-
49
-
50
-
51
-
52
-
53
-
54
-
55
-
56
-
57
-
58
-
59
-
60
-
61
-
62
-
63
-
64
-
65
-
66
-
67
-
68
-
69
-
70
-
71
-
72
-
73
-
 74
74 -
 75
75 -
 76
76 -
 77
77 -
 78
78 -
 79
79 -
 80
80 -
 81
81 -
 82
82 -
 83
83 -
 84
84 -
 85
85 -
 86
86 -
 87
87 -
 88
88 -
 89
89 -
 90
90 -
 91
91 -
 92
92 -
 93
93 -
 94
94 -
95
-
96
-
97
-
98
-
99
-
100
-
101
-
102
-
103
-
104
-
105
-
106
-
107
-
108
-
109
-
110
-
111
-
112
-
113
-
114
-
115
-
116
-
117
-
118
-
119
-
120
-
121
-
122
-
123
-
124
-
125
-
126
-
127
-
128
-
129
-
130
-
131
-
132
-
133
-
134
-
135
-
136
-
137
-
138
-
139
-
140
 |
 |

82 ANNUAL REPORT 2007
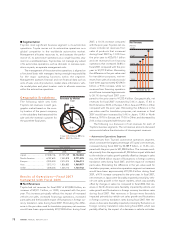
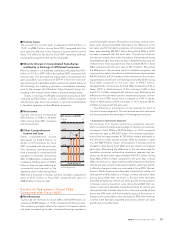
•Financial Services Operations Segment
Net revenues in fiscal 2006 for Toyota’s financial services opera-
tions increased by ¥215.7 billion or 27.6% compared to the prior
year to ¥996.9 billion. This increase resulted primarily from the
impact of a higher volume of financings mainly in North America
and the favorable impact of fluctuations in foreign currency trans-
lation rates during fiscal 2006. Eliminating the difference in the
yen value used for translation purposes, financial services opera-
tions net revenues would have been approximately ¥952.0 billion
during fiscal 2006, a 21.9% increase compared with the prior year.
• All Other Operations Segment
Net revenues for Toyota’s other businesses increased by ¥160.0
billion, or 15.5%, to ¥1,190.3 billion during fiscal 2006 compared
with the prior year. This increase primarily relates to increased
sales attributed to the housing business and the expansion of
intelligent transport systems operations.
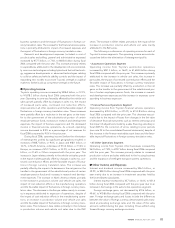
■Operating Costs and Expenses
Operating costs and expenses increased by ¥2,279.3 billion, or
13.5%, to ¥19,158.6 billion during fiscal 2006 compared with the
prior year. The increase resulted primarily from the approximate
¥1,000 billion impact on costs of products attributed to vehicle
unit sales growth partially offset by changes in sales mix, a ¥587.2
billion impact of fluctuations in foreign currency translation rates,
a ¥57.5 billion increase in research and development expenses, a
¥47.2 billion decrease in net gain on the transfer to the govern-
ment of the substitutional portion of certain employee pension
funds in Japan, increased expenses in expanding business opera-
tions and increased costs related to the corresponding increase
in parts sales. These increases were partially offset by the approx-
imate ¥130 billion impact attributed to the net impact of cost
reduction efforts including rise in prices of production materials
and parts in fiscal 2006.
In 2001, the Corporate Defined Benefit Pension Plan Law was
enacted and allowed a company to transfer the substitutional
portion of the obligation to the government. The parent compa-
ny and certain subsidiaries in Japan applied for an exemption
from the payment of benefits related to future employee services
with respect to the substitutional portion of their employee pen-
sion funds and obtained approval from the Minister of Health,
Labor, and Welfare. These companies also applied for approval
for the separation of the benefit obligations of the substitutional
portion which relates to past employee services. After approval
was obtained, several subsidiaries in Japan completed the trans-
fers of the government-specified portion of plan assets relating
to the substitutional portion in fiscal 2005. The gains and losses
relating to these transfers were treated in accordance with the
Emerging Issues Task Force (“EITF”) No. 03-02, Accounting for
the Transfer to the Japanese Government of the Substitutional
Portion of Employee Pension Fund Liabilities.
In connection with these transfers, for fiscal 2005, settlement
losses relating to the transfer of the substitutional portion was
¥74.3 billion and was reflected in cost of products sold (¥65.9 bil-
lion) and selling, general and administrative expenses (¥8.4 bil-
lion). In addition, the government subsidy representing the differ-
ence between the benefit obligations of the substitutional
portion and the government-specified portion of plan assets of
¥121.5 billion for fiscal 2005 which was transferred to the govern-
ment, reduced selling, general and administrative expenses. The
net impact of this item was a reduction of operating expenses by
¥47.2 billion during fiscal 2005. See note 19 to the consolidated
financial statements.
Continued cost reduction efforts reduced operating costs
and expenses in fiscal 2006 by approximately ¥130 billion, partial-
ly offset by increases in the prices of steel, precious metals, non-
ferrous alloys including aluminum, plastic parts and other
production materials and parts, over what would have otherwise
been incurred. These cost reduction efforts relate to ongoing
value engineering and value analysis activities, the use of common
parts that result in a reduction of part types and other manufac-
turing initiatives designed to reduce the costs of vehicle production.
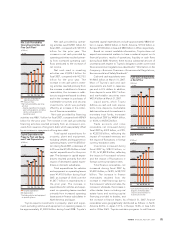
Cost of products sold increased by ¥1,835.1 billion, or 12.7%,
to ¥16,335.3 billion during fiscal 2006 compared with the prior
year. This increase (before the elimination of intersegment
amounts) reflects an increase of ¥1,790.5 billion, or 12.9%, for the
automotive operations and an increase of ¥142.2 billion, or
16.3%, for the all other operations segment. The increase in cost
of products sold for automotive operations is primarily attributed
to the increased vehicle unit sales partially offset by changes in
sales mix, the impact of increased parts sales, the impact of the
increase in research and development expenses and the impact
of fluctuations in foreign currency translation rates during fiscal
2006, which were partially offset by the impact of continued cost
reduction efforts and the impact of decrease in the settlement
losses relating to the transfer to the government of the substitu-
tional portion. The increase in cost of products sold for all other
operations primarily related to the increase in net revenues.
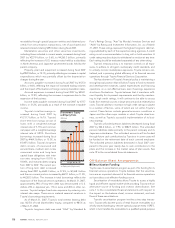
Cost of financing operations increased by ¥239.9 billion, or
64.8%, to ¥609.7 billion during fiscal 2006 compared with the
prior year. The increase resulted primarily from the impact of
increased interest expenses caused primarily by higher interest
rates and an increase in borrowings attributed to business expan-
sion in the United States and the impact of losses due to changes
in the fair value of derivative financial instruments that are not
designated as hedges and are marked-to-market at the end of
each period.
Selling, general and administrative expenses increased by
¥204.4 billion, or 10.2%, to ¥2,213.6 billion during fiscal 2006 com-
pared with the prior year. This increase (before the elimination of
intersegment amounts) reflects an increase of ¥192.6 billion, or
10.6%, for the automotive operations, a increase of ¥23.2 billion,
or 11.4%, for the financial services operations and an increase of
¥11.8 billion, or 9.6%, for all other operations segment. The
increase for the automotive operations consisted primarily of the
impact from the reduction of gains attributed to the transfer of
the substitutional portion of certain employee pension funds to
the government, the impact of increased expenses in expanding