APC 2003 Annual Report Download - page 101
Download and view the complete annual report
Please find page 101 of the 2003 APC annual report below. You can navigate through the pages in the report by either clicking on the pages listed below, or by using the keyword search tool below to find specific information within the annual report.-
 1
1 -
2
-
3
-
4
-
5
-
6
-
7
-
8
-
9
-
10
-
11
-
12
-
13
-
14
-
15
-
16
-
17
-
18
-
19
-
20
-
21
-
22
-
23
-
24
-
25
-
26
-
27
-
28
-
29
-
30
-
31
-
32
-
33
-
34
-
35
-
36
-
37
-
38
-
39
-
40
-
41
-
42
-
43
-
44
-
45
-
46
-
47
-
48
-
49
-
50
-
51
-
52
-
53
-
54
-
55
-
56
-
57
-
58
-
59
-
60
-
61
-
62
-
63
-
64
-
65
-
66
-
67
-
68
-
69
-
70
-
71
-
72
-
73
-
74
-
75
-
76
-
77
-
78
-
79
-
80
-
81
-
82
-
83
-
84
-
85
-
86
-
87
-
88
-
89
-
90
-
 91
91 -
 92
92 -
 93
93 -
 94
94 -
 95
95 -
 96
96 -
 97
97 -
 98
98 -
 99
99 -
 100
100 -
 101
101 -
 102
102 -
 103
103 -
 104
104 -
 105
105 -
 106
106 -
 107
107 -
 108
108 -
 109
109 -
 110
110 -
 111
111 -
112
-
113
-
114
-
115
-
116
-
117
-
118
-
119
-
120
-
121
-
122
-
123
-
124
-
125
-
126
-
127
-
128
-
129
-
130
-
131
-
132
-
133
-
134
-
135
-
136
-
137
-
138
-
139
-
140
-
141
-
142
-
143
-
144
-
145
 |
 |

99
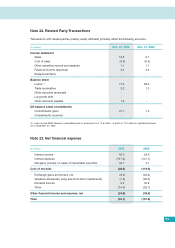
Note 22. Related Party Transactions
Transactions with related parties (mainly equity affiliates) primarily affect the following accounts:
(
€
millions)
Dec. 31, 2003 Dec. 31, 2002
Income statement
Sales 12.5 6.1
Cost of sales (4.5) (0.4)
Other operating income and expense 1.1 1.1
Financial income (expense) 3.4 3.2
Exceptional items - -
Balance sheet
Loans (1) 71.6 68.2
Trade receivables 3.2 1.3
Other accounts receivable - -
Long-term debt - -
Other accounts payable 1.2 -
Off balance sheet commitments
Commitments given 37.7 1.3
Commitments received - -
(1) Loans include MGE Finances convertible bonds in an amount of
€
71.6 million, of which
€
11.9 million in capitalized interest,
as of December 31, 2003.
Note 23. Net financial expense
(
€
millions)
2003 2002
Interest income 46.3 24.6
Interest expense (117.2) (147.1)
Net gains (losses) on sales of marketable securities 42.7 3.1
Cost of net debt (28.2) (119.4)
Exchange gains and losses, net (9.4) (24.2)
Valuation allowances (long and short-term investments) (7.4) (25.0)
Dividend income 6.3 36.9
Other (14.4) (26.1)
Other financial income and expense, net (24.9) (38.4)
Total (53.1) (157.8)