APC 2003 Annual Report Download - page 89
Download and view the complete annual report
Please find page 89 of the 2003 APC annual report below. You can navigate through the pages in the report by either clicking on the pages listed below, or by using the keyword search tool below to find specific information within the annual report.-
 1
1 -
2
-
3
-
4
-
5
-
6
-
7
-
8
-
9
-
10
-
11
-
12
-
13
-
14
-
15
-
16
-
17
-
18
-
19
-
20
-
21
-
22
-
23
-
24
-
25
-
26
-
27
-
28
-
29
-
30
-
31
-
32
-
33
-
34
-
35
-
36
-
37
-
38
-
39
-
40
-
41
-
42
-
43
-
44
-
45
-
46
-
47
-
48
-
49
-
50
-
51
-
52
-
53
-
54
-
55
-
56
-
57
-
58
-
59
-
60
-
61
-
62
-
63
-
64
-
65
-
66
-
67
-
68
-
69
-
70
-
71
-
72
-
73
-
74
-
75
-
76
-
77
-
78
-
 79
79 -
 80
80 -
 81
81 -
 82
82 -
 83
83 -
 84
84 -
 85
85 -
 86
86 -
 87
87 -
 88
88 -
 89
89 -
 90
90 -
 91
91 -
 92
92 -
 93
93 -
 94
94 -
 95
95 -
 96
96 -
 97
97 -
 98
98 -
 99
99 -
100
-
101
-
102
-
103
-
104
-
105
-
106
-
107
-
108
-
109
-
110
-
111
-
112
-
113
-
114
-
115
-
116
-
117
-
118
-
119
-
120
-
121
-
122
-
123
-
124
-
125
-
126
-
127
-
128
-
129
-
130
-
131
-
132
-
133
-
134
-
135
-
136
-
137
-
138
-
139
-
140
-
141
-
142
-
143
-
144
-
145
 |
 |

87
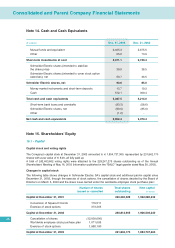
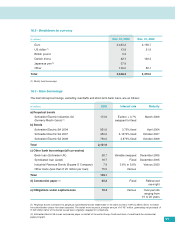
15.2 - Ownership Structure
Dec. 31, 2003 Dec. 31, 2002 Dec. 31, 2001
% Number % Number % % % %
interest of shares voting of voting interest voting interest voting
rights rights rights rights
Caisse des Dépôts
et Consignations 4.34 % 10,062,852 5.23 % 13,237,852 3.99 % 5.21 % 3.92 % 5.06 %
Employees 3.62 % 8,385,425 6.00 % 15,203,302 3.11 % 5.85 % 3.00 % 5.68 %
Intra-group cross
shareholdings (1) 0.93 % 2,150,352 - - 0.89 % - 0.89 % -
Treasury stock 2.90 % 6,716,753 - - 6.73 % - 3.94 % -
Public 88.21 % 204,526,788 88.77 % 224,859,766 85.28 % 88.94 % 88.25 % 89.26 %
Total 100.00 % 231,842,170 100.00 % 253,300,920 100.00 % 100.00 % 100.00 % 100.00 %
(1) Held through Cofibel / Cofimines
No shareholders’ agreements were in force as of December 31, 2003.
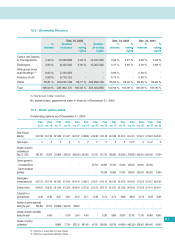
15.3 - Stock option plans
Outstanding options as of December 31, 2003
Plan Plan Plan Plan Plan Plan Plan Plan Plan Plan Plan Plan Plan Plan
no. 9 no. 10 no. 11 no. 12 no. 13 no. 14 no. 15 no. 16 no. 17 no. 18 no. 19 no. 20 no. 21 no. 22
Date of Board
Meeting 04.07.95 04.07.95 06.13.96 01.24.97 06.10.97 01.28.98 12.22.98 04.01.99 04.01.99 03.24.00 04.04.01 12.12.01 02.05.03 02.05.03
Type de plan SSSSSPPPPPS or PSS or PS
Number of options
outstanding at
Dec. 31, 2002 362,800 50,870 353,940 1,198,200 653,630 1,001,800 46,700 937,700 963,200 682,950 1,518,825 1,600,000 2,000,000 111,000
Options granted to:
- Corporate officers ------46,700 85,600 107,400 63,000 205,500 100,000 150,000 -
- Top ten employee
grantees -------118,200 124,000 87,900 163,600 333,000 345,000 10,000
Starting date
of exercise period 04.07.00 04.07.00 06.13.01 01.24.00 06.10.00 01.28.01 12.22.01 04.01.02 04.01.02 03.24.03 04.04.05 12.12.04 02.04.07 06.05.03
Expiration date 04.06.03 04.06.03 06.12.04 01.23.04 06.09.04 01.27.05 12.21.05 03.31.07 03.31.07 03.23.08 04.03.09 12.11.09 02.04.11 02.04.11
Subscription or
purchase price 24.93 24.93 35.37 35.67 44.52 50.77 50.86 50.73 50.73 65.88 68.80 51.76 45.65 45.65
Number of options exercised
during the year 362,800 45,270 263,990 1,166,200 119,920 ---------
Number of options cancelled
during the year - 5,600 - 5,000 1,500 4,400 - 9,200 9,500 38,300 33,300 71,100 49,600 18,000
Number of options
outstanding - - 89,950 27,000 532,210 997,400 46,700 928,500 953,700 644,650 1,485,525 1,528,900 1,950,400 93,000
S : Options to subscribe for new shares
A : Options to purchase existing shares