APC 2003 Annual Report Download - page 114
Download and view the complete annual report
Please find page 114 of the 2003 APC annual report below. You can navigate through the pages in the report by either clicking on the pages listed below, or by using the keyword search tool below to find specific information within the annual report.-
 1
1 -
2
-
3
-
4
-
5
-
6
-
7
-
8
-
9
-
10
-
11
-
12
-
13
-
14
-
15
-
16
-
17
-
18
-
19
-
20
-
21
-
22
-
23
-
24
-
25
-
26
-
27
-
28
-
29
-
30
-
31
-
32
-
33
-
34
-
35
-
36
-
37
-
38
-
39
-
40
-
41
-
42
-
43
-
44
-
45
-
46
-
47
-
48
-
49
-
50
-
51
-
52
-
53
-
54
-
55
-
56
-
57
-
58
-
59
-
60
-
61
-
62
-
63
-
64
-
65
-
66
-
67
-
68
-
69
-
70
-
71
-
72
-
73
-
74
-
75
-
76
-
77
-
78
-
79
-
80
-
81
-
82
-
83
-
84
-
85
-
86
-
87
-
88
-
89
-
90
-
91
-
92
-
93
-
94
-
95
-
96
-
97
-
98
-
99
-
100
-
101
-
102
-
103
-
 104
104 -
 105
105 -
 106
106 -
 107
107 -
 108
108 -
 109
109 -
 110
110 -
 111
111 -
 112
112 -
 113
113 -
 114
114 -
 115
115 -
 116
116 -
 117
117 -
 118
118 -
 119
119 -
 120
120 -
 121
121 -
 122
122 -
 123
123 -
 124
124 -
125
-
126
-
127
-
128
-
129
-
130
-
131
-
132
-
133
-
134
-
135
-
136
-
137
-
138
-
139
-
140
-
141
-
142
-
143
-
144
-
145
 |
 |

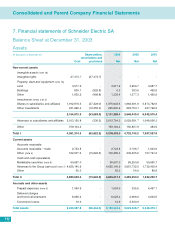
Consolidated and Parent Company Financial Statements
112
7. Financial statements of Schneider Electric SA
Balance Sheet at December 31, 2003
Assets
(
€
thousands, at December 31)
Depreciation, 2003 2002 2001
amortization and
Cost
provisions
Net Net Net
Non-current assets
Intangible assets (note 1a)
Intangible rights 27,473.7 (27,473.7) - - -
Property, plant and equipment (note 1b)
Land 3,917.2 - 3,917.2 3,959.7 3,987.7
Buildings 830.1 (829.8) 0.3 383.6 492.6
Other 1,835.2 (498.8) 1,336.4 1,377.3 1,420.9
Investments (notes 2 et 3)
Shares in subsidiaries and affiliates 1,912,976.5 (37,328.0) 1,875,648.5 1,882,691.9 5,874,782.6
Other investments 241,996.4 (16,355.5) 225,640.9 663,753.1 467,792.8
2,154,972.9 (53,683.5) 2,101,289.4 2,546,445.0 6,342,575.4
Advances to subsidiaries and affiliates 2,013,120.8 (336.5) 2,012,784.3 2,029,691.7 1,048,066.3
Other 159,164.4 - 159,164.4 150,887.9 484.9
Total I 4,361,314.3 (82,822.3) 4,278,492.0 4,732,745.2 7,397,027.8
Current assets
Accounts receivable
Accounts receivable – trade 2,723.8 - 2,723.8 3,706.7 1,043.6
Other
(note 4)
162,007.6 (15,622.2) 146,385.4 239,205.6 157,791.2
Cash and cash equivalents
Marketable securities
(note 6)
90,697.0 - 90,697.0 89,250.8 50,960.7
A
dvances to the Group cash pool
(note 7)
4,625,145.9 - 4,625,145.9 3,951,732.0 1,732,405.4
Other 65.3 - 65.3 54.9 89.8
Total II 4,880,639.6 (15,622.2) 4,865,017.4 4,283,950.0 1,942,290.7
Accruals and other assets
Prepaid expenses
(note 5)
1,094.9 - 1,094.9 535.5 4,497.1
Deferred charges
and bond call premiums 6,028.4 - 6,028.4 2,968.0 4,663.5
Conversion losses 10.6 - 10.6 2,330.0 -
Total assets 9,249,087.8 (98,444.5) 9,150,643.3 9,022,528.7 9,348,479.1