APC 2003 Annual Report Download - page 45
Download and view the complete annual report
Please find page 45 of the 2003 APC annual report below. You can navigate through the pages in the report by either clicking on the pages listed below, or by using the keyword search tool below to find specific information within the annual report.-
 1
1 -
2
-
3
-
4
-
5
-
6
-
7
-
8
-
9
-
10
-
11
-
12
-
13
-
14
-
15
-
16
-
17
-
18
-
19
-
20
-
21
-
22
-
23
-
24
-
25
-
26
-
27
-
28
-
29
-
30
-
31
-
32
-
33
-
34
-
 35
35 -
 36
36 -
 37
37 -
 38
38 -
 39
39 -
 40
40 -
 41
41 -
 42
42 -
 43
43 -
 44
44 -
 45
45 -
 46
46 -
 47
47 -
 48
48 -
 49
49 -
 50
50 -
 51
51 -
 52
52 -
 53
53 -
 54
54 -
 55
55 -
56
-
57
-
58
-
59
-
60
-
61
-
62
-
63
-
64
-
65
-
66
-
67
-
68
-
69
-
70
-
71
-
72
-
73
-
74
-
75
-
76
-
77
-
78
-
79
-
80
-
81
-
82
-
83
-
84
-
85
-
86
-
87
-
88
-
89
-
90
-
91
-
92
-
93
-
94
-
95
-
96
-
97
-
98
-
99
-
100
-
101
-
102
-
103
-
104
-
105
-
106
-
107
-
108
-
109
-
110
-
111
-
112
-
113
-
114
-
115
-
116
-
117
-
118
-
119
-
120
-
121
-
122
-
123
-
124
-
125
-
126
-
127
-
128
-
129
-
130
-
131
-
132
-
133
-
134
-
135
-
136
-
137
-
138
-
139
-
140
-
141
-
142
-
143
-
144
-
145
 |
 |

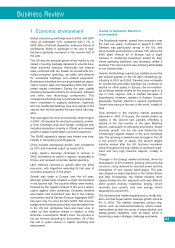
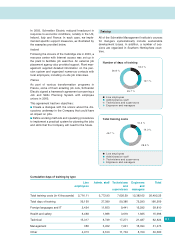
1. Economic environment
Global economic growth improved in 2003, with GDP
rising an estimated 3.4% compared with 1.7% in
2002. After a first half shaped by numerous factors of
uncertainty, linked in particular to the war in Iraq,
business gradually recovered in the second half of
the year.
The US was the principal growth driver thanks to the
impact of a policy package designed to provide max-
imum economic stimulus. Historically low interest
rates combined with tax breaks for households pro-
moted consumer spending, car sales, and demand
for residential buildings and related equipment.
Businesses benefited from an accelerated tax depre-
ciation system valid until September 2004 that stim-
ulated capital investment. During the year, capital
spending increased primarily for computers, software
and other new technology components. This
increased productivity but not manufacturing employ-
ment. Investment in capacity extension, machines
and non-residential buildings rose very slightly in the
second half, but the general full-year trend was neg-
ative.
Asia was again the most economically vibrant region
in 2003. US demand for electronic products, primari-
ly from Southeast Asia and Taiwan, combined with
industrial relocations (mainly in China) and renewed
growth in Japan fueled faster economic expansion.
The SARS epidemic’s impact was limited over time,
notably in Hong Kong and Singapore.
China enjoyed spectacular growth, with investment
up 23% and industrial output up nearly 20%.
Lastly, Japan’s economy continued to recover in
2003, boosted by an upturn in exports –especially to
China– and renewed corporate capital spending.
Latin America returned to growth after the 2002
recession, with Argentina recording its first year of
economic expansion in five years.
Growth was weak in Europe over the full year,
although global trade enabled a slight improvement
in the second half. The positive effects were limited,
however by the negative impact of the euro’s appre-
ciation against other currencies. Domestic demand
was feeble and investment was flat in the mature
economies outside Eastern Europe. Aggregate GDP
has risen only 1% since the fall of 2001. Not only has
budget and monetary policy been less favorable than
in the US, but companies have also been slow to
clean up their balance sheets in relation to their
American counterparts. What’s more, the process is
not yet finished according to economists. All of this
has led to great caution in capital spending and
employment.
43
Business Review
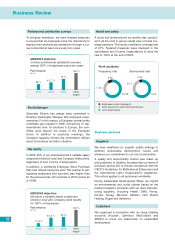
Trends in Schneider Electric’s
core markets
The Residential market, spared from recession over
the past two years, continued to expand in 2003.
Demand was particularly strong in the US, with
record growth and business volumes 18% above the
2000 peak. Almost all of Europe saw a slight
increase in residential investment except for Italy,
where spending stabilized, and Germany, where it
declined. The improvement was primarily attributable
to low interest rates.
Overall, the Buildings market has stabilized over the
last several quarters in the US after contracting sig-
nificantly in 2001 and 2002. Demand rose noticeably
for commercial and public buildings but continued to
decline for office space. In Europe, the non-residen-
tial buildings market shrank for the second year in a
row in most regions, with a marked decrease in
Scandinavia. However, markets in Eastern Europe
(especially Russia) started to expand significantly.
Growth was strong in the rest of the world, notably in
Asia.
Total demand in the Industry market gradually
improved in 2003. In Europe, the market picked up
slightly in the second half, partially offsetting a
decline in the first months of the year. Machine
exports, particularly to emerging economies, fueled
business growth, but the rise was limited by the
increasingly negative impact of the euro exchange
rate. The upswing in demand was stronger in the US
in the second half. In Japan, the second largest
industry market after the US, business recovered
nicely throughout the year thanks to renewed invest-
ment and very high machine exports, notably to
China.
Changes in the Energy market continued, driven by
deregulation of end markets, growing environmental
concerns, rising demand for secured power and the
emergence of new energy technologies. The year
was shaped by major blackouts in the United States
and Italy. Increasingly, the market became more
clearly divided into two segments with very different
2003 growth profiles: traditional energy, which
recorded zero growth, and new energy, which
expanded by around 8%.
The Infrastructure market experienced a similar situ-
ation, but that began earlier. Average growth stood at
4% in 2003. The market comprises cyclical seg-
ments, such as telecommunications, where invest-
ment picked up after two years of sharp decline, and
steady-growth segments, such as water, which is
becoming a major strategic challenge worldwide.