APC 2003 Annual Report Download - page 81
Download and view the complete annual report
Please find page 81 of the 2003 APC annual report below. You can navigate through the pages in the report by either clicking on the pages listed below, or by using the keyword search tool below to find specific information within the annual report.-
 1
1 -
2
-
3
-
4
-
5
-
6
-
7
-
8
-
9
-
10
-
11
-
12
-
13
-
14
-
15
-
16
-
17
-
18
-
19
-
20
-
21
-
22
-
23
-
24
-
25
-
26
-
27
-
28
-
29
-
30
-
31
-
32
-
33
-
34
-
35
-
36
-
37
-
38
-
39
-
40
-
41
-
42
-
43
-
44
-
45
-
46
-
47
-
48
-
49
-
50
-
51
-
52
-
53
-
54
-
55
-
56
-
57
-
58
-
59
-
60
-
61
-
62
-
63
-
64
-
65
-
66
-
67
-
68
-
69
-
70
-
 71
71 -
 72
72 -
 73
73 -
 74
74 -
 75
75 -
 76
76 -
 77
77 -
 78
78 -
 79
79 -
 80
80 -
 81
81 -
 82
82 -
 83
83 -
 84
84 -
 85
85 -
 86
86 -
 87
87 -
 88
88 -
 89
89 -
 90
90 -
 91
91 -
92
-
93
-
94
-
95
-
96
-
97
-
98
-
99
-
100
-
101
-
102
-
103
-
104
-
105
-
106
-
107
-
108
-
109
-
110
-
111
-
112
-
113
-
114
-
115
-
116
-
117
-
118
-
119
-
120
-
121
-
122
-
123
-
124
-
125
-
126
-
127
-
128
-
129
-
130
-
131
-
132
-
133
-
134
-
135
-
136
-
137
-
138
-
139
-
140
-
141
-
142
-
143
-
144
-
145
 |
 |

79
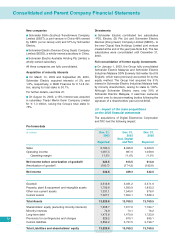
7.2 - VA Tech Schneider High Voltage GmbH
VA Tech Schneider High Voltage GmbH was consolidated on December 31, 2003 on the basis of estimated
financial statements.
a) Consolidated Balance Sheet
(
€
millions)
Dec. 31, 2003 Dec. 31, 2002
Goodwill, net 38.5 47.4
Non-current assets, net 69.7 72.4
Current assets and cash and equivalents 461.9 492.5
Total assets 570.1 612.3
Shareholders’ equity excluding minority interests 39.5 73.6
Minority interests 0.6 0.5
Long-term debt (including provisions) 124.0 118.2
Current liabilities 406.0 420.0
Total liabilities and shareholders’ equity 570.1 612.3
b) Consolidated Statement of Operations
(
€
millions)
2003 2002
Sales 611.3 680.0
Operating income (loss) (3.2) 24.9
Financial expense, net (8.8) (9.8)
Amortization of goodwill (8.1) (9.8)
Exceptional items (10.0) (20.7)
Income taxes (3.9) (3.0)
Net loss of fully consolidated companies (33.9) (18.4)
Provisional loss (33.9) (18.4)
Consolidation adjustments:
Prior year adjustments (2.9) (5.3)
Other restatements on consolidation 4.0 0.3
Restated net loss (32.8) (23.4)
b) Consolidated Statement of Operations
(
€
millions)
2003 2002
Sales 497.2 568.4
Cost of sales (320.1) (372.7)
Selling, general and administrative expenses (115.8) (125.6)
Operating income 61.3 70.1
Financial expense, net (34.1) (39.4)
Amortization of goodwill (33.1) (33.0)
Exceptional items 1.7 (15.2)
Income taxes (9.0) (11.3)
Net loss before minority interests (13.2) (28.8)
Minority interests (1.8) (2.9)
Net loss (15.0) (31.7)