APC 2003 Annual Report Download - page 129
Download and view the complete annual report
Please find page 129 of the 2003 APC annual report below. You can navigate through the pages in the report by either clicking on the pages listed below, or by using the keyword search tool below to find specific information within the annual report.-
 1
1 -
2
-
3
-
4
-
5
-
6
-
7
-
8
-
9
-
10
-
11
-
12
-
13
-
14
-
15
-
16
-
17
-
18
-
19
-
20
-
21
-
22
-
23
-
24
-
25
-
26
-
27
-
28
-
29
-
30
-
31
-
32
-
33
-
34
-
35
-
36
-
37
-
38
-
39
-
40
-
41
-
42
-
43
-
44
-
45
-
46
-
47
-
48
-
49
-
50
-
51
-
52
-
53
-
54
-
55
-
56
-
57
-
58
-
59
-
60
-
61
-
62
-
63
-
64
-
65
-
66
-
67
-
68
-
69
-
70
-
71
-
72
-
73
-
74
-
75
-
76
-
77
-
78
-
79
-
80
-
81
-
82
-
83
-
84
-
85
-
86
-
87
-
88
-
89
-
90
-
91
-
92
-
93
-
94
-
95
-
96
-
97
-
98
-
99
-
100
-
101
-
102
-
103
-
104
-
105
-
106
-
107
-
108
-
109
-
110
-
111
-
112
-
113
-
114
-
115
-
116
-
117
-
118
-
 119
119 -
 120
120 -
 121
121 -
 122
122 -
 123
123 -
 124
124 -
 125
125 -
 126
126 -
 127
127 -
 128
128 -
 129
129 -
 130
130 -
 131
131 -
 132
132 -
 133
133 -
 134
134 -
 135
135 -
 136
136 -
 137
137 -
 138
138 -
 139
139 -
140
-
141
-
142
-
143
-
144
-
145
 |
 |

127
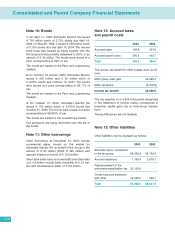
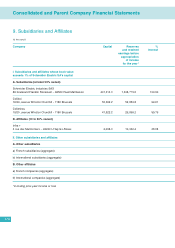
11. Five-year Financial Summary
1999 2000 2001 2002 2003
Capital and Potential Capital
at December 31
Capital stock
(in thousands of euros)
1,230,443 1,246,301 1,922,080 1,926,503 1,854,737
Shares in issue 161,423,578 155,787,643 240,260,029 240,812,905 231,842,170
Convertible bonds in issue
(in thousands)
1----
Maximum number of shares
to be created
(in thousands)
:
- Through conversion of bonds 343 191 - - -
- Through exercise of rights 3,512 3,261 4,587 4,226 2,271
Results of Operations
(in thousands of euros)
Sales net of VAT 3,865.3 2,728.5 1,368.1 1,979.5 1,896.2
Investment revenue, interest income
and other revenue 312,575.4 443,613.6 740,644.2 676,937.9 640,884.3
Income before tax, depreciation,
amortization and provisions 255,739.0 301,958.6 521,908.4 156,103.2 395,142.7
Income tax (IFA) 3.8 - - - 5,835.4
Net income 316,704.3 356,657.1 (811,224.0) 221,139.4 474,732.4
Dividends paid (1) excluding
précompte
equalization tax and tax credit 270,272.7 249,260.2 312,338.0 228,812.9 (2) 255,026.4
Per Share Data
(in euros)
Net income before depreciation,
amortization and provisions 1.40 1.94 2.29 1.30 1.79
Earnings per share 1.96 2.29 (3.38) 0.92 2.05
Dividend per share, net of tax credit 1.34 1.60 1.30 1.00 1.10
Employees
Average number of employees
during the year 86533
Total payroll for the year
(in thousands of euros)
3,198.2 3,975.9 4,468.9 3,822.5 2,213.1
Total employee benefits paid over
the year (payroll taxes, other benefits)
(in thousands of euros)
1,736.8 901.7 914.1 668.3 415.5
(1) Dividends paid to shares held in treasury on the dividend payment date and the associated précompte tax are credited to retained earnings.
(2) After cancellation of 12 million shares.