APC 2003 Annual Report Download - page 73
Download and view the complete annual report
Please find page 73 of the 2003 APC annual report below. You can navigate through the pages in the report by either clicking on the pages listed below, or by using the keyword search tool below to find specific information within the annual report.-
 1
1 -
2
-
3
-
4
-
5
-
6
-
7
-
8
-
9
-
10
-
11
-
12
-
13
-
14
-
15
-
16
-
17
-
18
-
19
-
20
-
21
-
22
-
23
-
24
-
25
-
26
-
27
-
28
-
29
-
30
-
31
-
32
-
33
-
34
-
35
-
36
-
37
-
38
-
39
-
40
-
41
-
42
-
43
-
44
-
45
-
46
-
47
-
48
-
49
-
50
-
51
-
52
-
53
-
54
-
55
-
56
-
57
-
58
-
59
-
60
-
61
-
62
-
 63
63 -
 64
64 -
 65
65 -
 66
66 -
 67
67 -
 68
68 -
 69
69 -
 70
70 -
 71
71 -
 72
72 -
 73
73 -
 74
74 -
 75
75 -
 76
76 -
 77
77 -
 78
78 -
 79
79 -
 80
80 -
 81
81 -
 82
82 -
 83
83 -
84
-
85
-
86
-
87
-
88
-
89
-
90
-
91
-
92
-
93
-
94
-
95
-
96
-
97
-
98
-
99
-
100
-
101
-
102
-
103
-
104
-
105
-
106
-
107
-
108
-
109
-
110
-
111
-
112
-
113
-
114
-
115
-
116
-
117
-
118
-
119
-
120
-
121
-
122
-
123
-
124
-
125
-
126
-
127
-
128
-
129
-
130
-
131
-
132
-
133
-
134
-
135
-
136
-
137
-
138
-
139
-
140
-
141
-
142
-
143
-
144
-
145
 |
 |

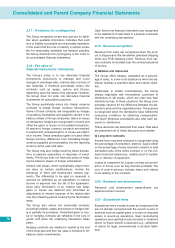
2.22 - Earnings per share
Primary earnings per share is calculated by dividing
the net income of the year by the weighted average
number of shares outstanding during that year.
Diluted earnings per share is calculated by adjusting
net income and the number of shares outstanding for
the dilutive effect of conversion of outstanding con-
vertible bonds and exercise of outstanding stock
options.
The dilutive effect of convertible bonds is determined
using the "if converted" method. The dilutive effect of
stock options is determined by applying the "treasury
stock" method.
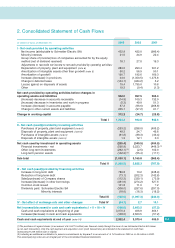
2.23 - Statement of cash flows
The consolidated statement of cash flows has been
prepared using the "indirect method", showing the
reconciliation of net income to net cash provided by
operations. Net cash and cash equivalents represent
cash and cash equivalents as presented in the bal-
ance sheets net of bank overdrafts.
Note 3. Changes in
Scope of Consolidation
3.1 - Additions and removals
The consolidated financial statements at December
31, 2003 include the financial statements of the com-
panies listed in Note 28.
The scope of consolidation at December 31, 2003,
2002 and 2001 is summarized as follows:
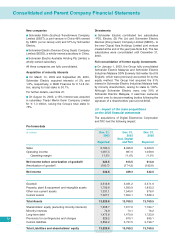
2003 highlights included:
Consolidation of Digital Electronics Corp.
■On November 8, 2002, Schneider Electric SA
made a public offer to buy all outstanding shares of
Japan’s Digital Electronics Corporation, listed on the
Osaka stock exchange. When the offer closed on
December 18, 2002, Schneider Electric SA had pur-
chased or subscribed 98.7% of the capital, or
7,680,680 shares. Settlement and delivery took
place on December 26, 2002, in a total amount of
€222.6 million. The interest in Digital Electronics
Corporation was fully consolidated on January 1,
2003.
Acquisitions
■On February 25, 2003, a 100% interest in Brazil-
based CDI Power was acquired for €1.8 million.
The company, which had sales of €2.2 million in
2003, was fully consolidated on March 1, 2003.
■On May 2, 2003, all outstanding shares of US-
based Hyde Park Electronics LLC, the North
American leader in ultrasonic sensing, were pur-
chased for $ 9.5 million. The company, with annual
sales of around €6 million, was fully consolidated on
May 2, 2003.
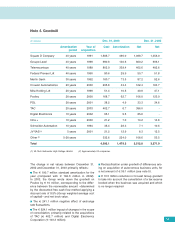
■TAC
On August 6, 2003, the Group acquired TAC, a major
manufacturer of building automation and control
equipment. TAC offers a full lineup of controllers, sen-
sors, display units and actuators combined with high-
performance supervision and design software.
Headquartered in Malmö, Sweden, TAC has 2,100
employees and operations in more than 70 coun-
tries. Sales totaled €324 million in 2003, with an
operating margin of 10.5%.
The acquisition was based on an enterprise value of
€452 million, of which €385 million for the compa-
ny’s shares and €67 million in assumed debt. TAC
was fully consolidated on September 1, 2003.
71
(Number of companies) At December 31
2003 2002 2001
France Abroad France Abroad France Abroad
Parent company and
fully consolidated subsidiaries 52 266 55 251 54 254
Proportionally consolidated
companies 1 1 1 1 1 -
Companies accounted
for by the equity method 2 7 2 9 2 4
Sub-total by region 55 274 58 261 57 258
Total 329 319 315