APC 2003 Annual Report Download - page 78
Download and view the complete annual report
Please find page 78 of the 2003 APC annual report below. You can navigate through the pages in the report by either clicking on the pages listed below, or by using the keyword search tool below to find specific information within the annual report.-
 1
1 -
2
-
3
-
4
-
5
-
6
-
7
-
8
-
9
-
10
-
11
-
12
-
13
-
14
-
15
-
16
-
17
-
18
-
19
-
20
-
21
-
22
-
23
-
24
-
25
-
26
-
27
-
28
-
29
-
30
-
31
-
32
-
33
-
34
-
35
-
36
-
37
-
38
-
39
-
40
-
41
-
42
-
43
-
44
-
45
-
46
-
47
-
48
-
49
-
50
-
51
-
52
-
53
-
54
-
55
-
56
-
57
-
58
-
59
-
60
-
61
-
62
-
63
-
64
-
65
-
66
-
67
-
 68
68 -
 69
69 -
 70
70 -
 71
71 -
 72
72 -
 73
73 -
 74
74 -
 75
75 -
 76
76 -
 77
77 -
 78
78 -
 79
79 -
 80
80 -
 81
81 -
 82
82 -
 83
83 -
 84
84 -
 85
85 -
 86
86 -
 87
87 -
 88
88 -
89
-
90
-
91
-
92
-
93
-
94
-
95
-
96
-
97
-
98
-
99
-
100
-
101
-
102
-
103
-
104
-
105
-
106
-
107
-
108
-
109
-
110
-
111
-
112
-
113
-
114
-
115
-
116
-
117
-
118
-
119
-
120
-
121
-
122
-
123
-
124
-
125
-
126
-
127
-
128
-
129
-
130
-
131
-
132
-
133
-
134
-
135
-
136
-
137
-
138
-
139
-
140
-
141
-
142
-
143
-
144
-
145
 |
 |

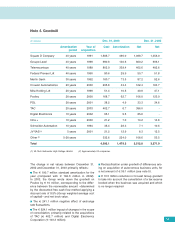
Note 6. Property, plant and equipment
6.1 - Changes in property, plant and equipment
Consolidated and Parent Company Financial Statements
76
a) Gross value
(
€
millions)
Land Buildings Plant and Other Total
equipment
December 31, 2001 144.9 844.2 2,470.2 738.5 4,197.8
Acquisitions 1.7 37.9 154.6 93.8 288.0
Disposals (2.3) (18.0) (109.6) (43.4) (173.3)
Translation adjustment (11.2) (41.1) (128.0) (44.6) (224.9)
Changes in scope of consolidation
and others (21.4) 37.6 78.2 (134.6) (1) (40.2)
December 31, 2002 111.7 860.6 2,465.4 609.7 4,047.4
Acquisitions 0.4 28.4 146.8 77.6 253.2
Disposals (4.5) (28.6) (152.0) (33.6) (218.7)
Translation adjustment (7.1) (41.4) (117.8) (36.3) (202.6)
Changes in scope of consolidation
and others 2.7 48.9 67.9 (93.0) 26.5
December 31, 2003 103.2 867.9 2,410.3 524.4 3,905.8
b) Accumulated depreciation
(
€
millions)
Land Buildings Plant and Other Total
equipment
December 31, 2001 (31.3) (395.8) (1,634.2) (385.5) (2,446.8)
Allocation (1.0) (31.1) (208.5) (52.8) (293.4)
Recapture 0.7 9.4 96.7 39.3 146 .1
Translation adjustment 2.8 10.4 70.8 29.7 113.6
Changes in scope of consolidation
and others 11.7 (11.8) (6.7) 13.2 6.4
December 31, 2002 (17.1) (418.9) (1,681.9) (356.1) (2,474.1)
Allocation (2.1) (36.7) (198.8) (45.8) (283.4)
Recapture 1.3 15.7 129.8 33.8 180.6
Translation adjustment 1.7 11.8 70.4 25.4 109.3
Changes in scope of consolidation
and others 0.5 (12.9) 3.7 9.6 0.9
December 31, 2003 (15.7) (441.0) (1,676.8) (333.1) (2,466.7)
c) Net value
(
€
millions)
Land Buildings Plant and Other Total
equipment
December 31, 2001 113.6 448.4 836.0 353.0 1,751.0
December 31, 2002 94.6 441.7 783.5 253.6 1,573.3
December 31, 2003 87.5 426.9 733.5 191.3 1,439.1
(1) SAP project costs were reclassified under intangible assets (software) in an amount of
€
41.9 million.