APC 2003 Annual Report Download - page 60
Download and view the complete annual report
Please find page 60 of the 2003 APC annual report below. You can navigate through the pages in the report by either clicking on the pages listed below, or by using the keyword search tool below to find specific information within the annual report.-
 1
1 -
2
-
3
-
4
-
5
-
6
-
7
-
8
-
9
-
10
-
11
-
12
-
13
-
14
-
15
-
16
-
17
-
18
-
19
-
20
-
21
-
22
-
23
-
24
-
25
-
26
-
27
-
28
-
29
-
30
-
31
-
32
-
33
-
34
-
35
-
36
-
37
-
38
-
39
-
40
-
41
-
42
-
43
-
44
-
45
-
46
-
47
-
48
-
49
-
 50
50 -
 51
51 -
 52
52 -
 53
53 -
 54
54 -
 55
55 -
 56
56 -
 57
57 -
 58
58 -
 59
59 -
 60
60 -
 61
61 -
 62
62 -
 63
63 -
 64
64 -
 65
65 -
 66
66 -
 67
67 -
 68
68 -
 69
69 -
 70
70 -
71
-
72
-
73
-
74
-
75
-
76
-
77
-
78
-
79
-
80
-
81
-
82
-
83
-
84
-
85
-
86
-
87
-
88
-
89
-
90
-
91
-
92
-
93
-
94
-
95
-
96
-
97
-
98
-
99
-
100
-
101
-
102
-
103
-
104
-
105
-
106
-
107
-
108
-
109
-
110
-
111
-
112
-
113
-
114
-
115
-
116
-
117
-
118
-
119
-
120
-
121
-
122
-
123
-
124
-
125
-
126
-
127
-
128
-
129
-
130
-
131
-
132
-
133
-
134
-
135
-
136
-
137
-
138
-
139
-
140
-
141
-
142
-
143
-
144
-
145
 |
 |

Business Review
58
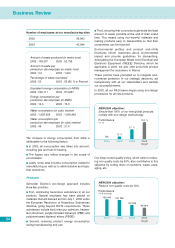
Breakdown by Operating Division
■At 11.8%, the European Operating Division’s
margin was higher than the Group average, but down
0.3 point from 2002 due to a negative currency effect
in certain non-euroland countries. Productivity gains
throughout the year were on a par with the Group
average.
■In the North American Operating Division, the
operating margin widened to 10.9% from 8.0% in
2002. This significant improvement stems from pro-
ductivity gains achieved by transferring production
capacity from the US to Mexico and from extensive
measures to rationalize production processes.
■The International Operating Division’s operating
margin contracted to 11.4% from 15.2% the year
before despite the highest productivity gains in the
Group, generated by relocating production. This
strategy significantly reduced costs and allowed us
to continue expanding in markets with high growth
potential. However, the currency effect had a consid-
erable negative impact.
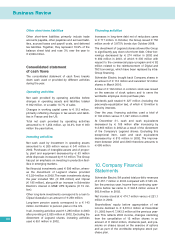
Financial expense
Net financial expense totaled € 53 million versus
€158 million in 2002. The €105 million improvement
stemmed primarily from lower interest expense.
Cash generated by the sale of the Company’s
Legrand shares at the end of 2002 was used to pay
down short-term debt. The surplus was invested,
making it possible to reduce net interest expense by
€91 million.
Exceptional items
Exceptional items represented a net charge of €164
million compared with €509 million in 2002. Last
year’s figure included a €398 million loss on the
divestment of Legrand shares.
In 2003, exceptional items included restructuring
costs and provisions in an amount of €135 million,
of which €65 million for operations in France, €14
million for reorganization of the automation business,
€40 million to close manufacturing sites in Europe
and €12 million for restructuring in the US (primari-
ly to close the Monroe and Asheville plants).
Income tax
The effective tax rate stood at 16.1% in 2003, reflect-
ing the impact of non-recurring deferred tax benefits.
In 2002, a €453 million deferred tax asset was rec-
ognized in respect of the tax loss on the sale of the
Legrand shares. This amount was determined based
on a conservative assessment of the recoverability of
the tax loss over the period 2003-2007, taking into
account the forecast taxable income of the Schneider
tax group in France for the years concerned.
Following elimination of the five-year time-limit for
using tax losses as from 2004, the Group increased
the amount of the recognized deferred tax asset by
€114 million in 2003.
Excluding the tax effects of the Legrand divestment,
the effective tax rate rose to 30.6% in 2003 from 28%
in 2002.
Amortization of goodwill
Amortization of goodwill represented a charge of
€191 million versus €193 million in 2002. The
charge includes €16 million due to the consolidation
of Digital and TAC and by another €10 million due to
exceptional goodwill amortization on the acquisition
of Positec. These increases were offset, however, by
a reduction in the goodwill amortization charge
denominated in US dollars and related currencies.
Group’s share of
losses of equity investments
The Group’s share of losses of equity investments
decreased to €18 million from €28 million in 2002,
thanks to improved results at MGE UPS Systems
and despite higher losses from VA Tech Schneider
HV.
Minority interests were stable at € 22 million and cor-
respond to the share of income attributable to minor-
ity partners in Feller AG and a number of Chinese
companies.
Net income attributable
to Schneider Electric SA
Net income rose 2.6% to €433 million.
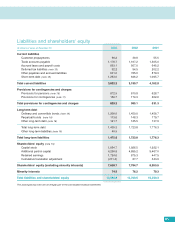
Balance sheet
Total assets were stable at €13,921 million at
December 31, 2003.
Non-current assets
Non-current assets amounted to €6,554 million and
represented 47.1% of total assets, an increase of
6.0% from 2002.
This amount includes €3,513 million in net goodwill,
which rose €141 million over the period.
Acquisitions added a gross €524 million, of which
€403 million for TAC and €103 million for Digital
Electronics, while reclassifications under goodwill of
differences arising on the acquisition of autonomous
business units contributed €59 million.This was par-
tially offset by an amortization charge of €191 mil-
lion and a €241 million negative currency effect.