APC 2003 Annual Report Download - page 95
Download and view the complete annual report
Please find page 95 of the 2003 APC annual report below. You can navigate through the pages in the report by either clicking on the pages listed below, or by using the keyword search tool below to find specific information within the annual report.-
 1
1 -
2
-
3
-
4
-
5
-
6
-
7
-
8
-
9
-
10
-
11
-
12
-
13
-
14
-
15
-
16
-
17
-
18
-
19
-
20
-
21
-
22
-
23
-
24
-
25
-
26
-
27
-
28
-
29
-
30
-
31
-
32
-
33
-
34
-
35
-
36
-
37
-
38
-
39
-
40
-
41
-
42
-
43
-
44
-
45
-
46
-
47
-
48
-
49
-
50
-
51
-
52
-
53
-
54
-
55
-
56
-
57
-
58
-
59
-
60
-
61
-
62
-
63
-
64
-
65
-
66
-
67
-
68
-
69
-
70
-
71
-
72
-
73
-
74
-
75
-
76
-
77
-
78
-
79
-
80
-
81
-
82
-
83
-
84
-
 85
85 -
 86
86 -
 87
87 -
 88
88 -
 89
89 -
 90
90 -
 91
91 -
 92
92 -
 93
93 -
 94
94 -
 95
95 -
 96
96 -
 97
97 -
 98
98 -
 99
99 -
 100
100 -
 101
101 -
 102
102 -
 103
103 -
 104
104 -
 105
105 -
106
-
107
-
108
-
109
-
110
-
111
-
112
-
113
-
114
-
115
-
116
-
117
-
118
-
119
-
120
-
121
-
122
-
123
-
124
-
125
-
126
-
127
-
128
-
129
-
130
-
131
-
132
-
133
-
134
-
135
-
136
-
137
-
138
-
139
-
140
-
141
-
142
-
143
-
144
-
145
 |
 |

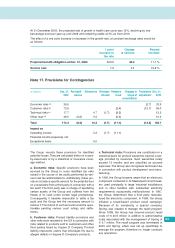
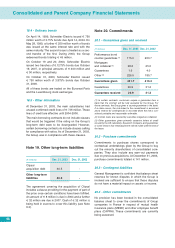
Note 17. Provisions for Contingencies
(
€
millions)
Dec. 31, Reclassifi- Allowances Releases Releases Changes in Translation Dec. 31,
2002 cations Unused Used scope of adjustment 2003
consolidation
Economic risks (a) 36.6 (2.7) 33.9
Customer risks (b) 73.5 (2.4) (12.1) 59.0
Technical risks (c) 17.7 4.7 (1.7) (8.2) 12.5
Other risks (d) 46.5 (0.2) 5.5 (0.5) 51.3
Total 174.3 (0.2) 10.2 (1.7) (11.1) (14.8) 156.7
Impact on
Operating income 5.2 (1.7) (11.1)
Financial income (expense), net
Exceptional items 5.0
93
The Group records these provisions for identified
potential losses. They are calculated either on a case-
by-case basis or by a statistical or insurance cover-
age method.
a. Economic risks: Specific provisions have been
accrued by the Group to cover identified tax risks
raised in the course of tax audits performed by vari-
ous local tax administrations. Additionally, these pro-
visions include a specific amount for the potential loss
on a receivable from a third party in connection with a
tax audit. The third party was in charge of liquidating
certain assets of the Group and suffered from the
freeze of its cash under certain legal proceedings.
Consequently, it became impossible to settle a tax
audit and the Group lent the necessary amount to
resolve it.The refund of such amounts could be ques-
tionable pending various court rulings and settle-
ments.
b. Customer risks: Product liability provisions and
other risks were recorded in the US in connection with
risks related to products sold to customers and other
third parties faced by Square D Company. Product
liability represents claims that individuals file due to
alleged defects in Square D Company’s products.
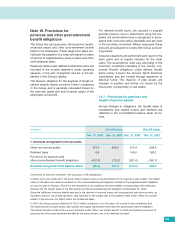
c. Technical risks: Provisions are constituted on a
statistical basis for product warranties beyond cover-
age provided by insurance. Such warranties rarely
exceed 12 months and are classified as accrued
expenses. The Group also recognizes technical risks
in connection with product development and manu-
facturing.
In 1996, the Group became aware that an electronic
component contained in its Masterpact circuit break-
ers used principally in large industrial installations
and in other facilities with substantial electricity
requirements occasionally malfunctioned. In 1997,
the Group determined that a third party manufac-
tured the electronic component. In 1998, the Group
initiated a broad-based product recall campaign.
Because of its complexity, a special company,
Spring, was created to manage the recall program.
Since 1998, the Group has incurred product recall
costs of € 40.9 million in addition to administrative
costs associated with the management of Spring of
€ 6.7 million. The recall program was terminated in
2003 and Spring, which was set up specifically to
manage the program, therefore no longer conducts
any operations.
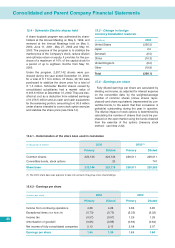
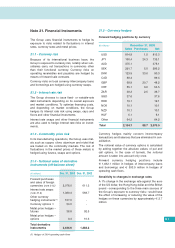
At 31 December 2003, the projected rate of growth in health care costs was 12%, declining by one
percentage point per year up until 2009 and remaining stable at 5% as from 2010.
The effect of a one point increase or decrease in the growth rate, at constant exchange rates would be
as follows:
1 point Change Percent
increase in €millions increase
the rate
Projected benefit obligation at Dec. 31, 2003 460.6 46.2 11.1 %
Service cost 7.9 1.1 16.2 %