APC 2003 Annual Report Download - page 7
Download and view the complete annual report
Please find page 7 of the 2003 APC annual report below. You can navigate through the pages in the report by either clicking on the pages listed below, or by using the keyword search tool below to find specific information within the annual report.-
 1
1 -
 2
2 -
 3
3 -
 4
4 -
 5
5 -
 6
6 -
 7
7 -
 8
8 -
 9
9 -
 10
10 -
 11
11 -
 12
12 -
 13
13 -
 14
14 -
 15
15 -
 16
16 -
 17
17 -
 18
18 -
19
-
20
-
21
-
22
-
23
-
24
-
25
-
26
-
27
-
28
-
29
-
30
-
31
-
32
-
33
-
34
-
35
-
36
-
37
-
38
-
39
-
40
-
41
-
42
-
43
-
44
-
45
-
46
-
47
-
48
-
49
-
50
-
51
-
52
-
53
-
54
-
55
-
56
-
57
-
58
-
59
-
60
-
61
-
62
-
63
-
64
-
65
-
66
-
67
-
68
-
69
-
70
-
71
-
72
-
73
-
74
-
75
-
76
-
77
-
78
-
79
-
80
-
81
-
82
-
83
-
84
-
85
-
86
-
87
-
88
-
89
-
90
-
91
-
92
-
93
-
94
-
95
-
96
-
97
-
98
-
99
-
100
-
101
-
102
-
103
-
104
-
105
-
106
-
107
-
108
-
109
-
110
-
111
-
112
-
113
-
114
-
115
-
116
-
117
-
118
-
119
-
120
-
121
-
122
-
123
-
124
-
125
-
126
-
127
-
128
-
129
-
130
-
131
-
132
-
133
-
134
-
135
-
136
-
137
-
138
-
139
-
140
-
141
-
142
-
143
-
144
-
145
 |
 |
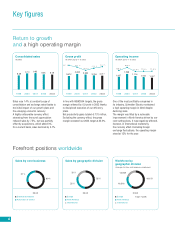
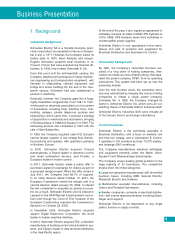
Record free cash flow*
and an increase in net income
5
968
929 991 966
10.7 %
9.8 %
10.7 %
11.1 % 10.2 %
942
Net cash provided
by operating activities
( million and as % of sales)
1999 2000 20022001 2003
In 2003, Schneider Electric again
demonstrated its strong ability to generate
cash. Net cash provided by operating activities
represented 94% of operating income and
nearly 11% of sales.
This is a crucial advantage for deploying
our growth strategy.
Net income (loss)
( million)
1999 2000 20022001 2003
433
491
625
422
(986)
Income from continuing operations before
tax rose 8% to € 954 million thanks to a
reduction in interest expense stemming from
lower debt.
After amortization of goodwill, net income
was up 3% at € 433 million.
989
333 243
538 592
6.5 %
5.5 %
11.3 %
4.0 %
2.5 %
Free cash flow*
( million and as % of sales)
1999 2000 20022001 2003
Free cash flow surged to a record € 989
million in 2003 thanks to sustained control
over capital spending and a significant
decrease in non-operating working capital
requirement. Free cash flow represented
11.3% of sales.
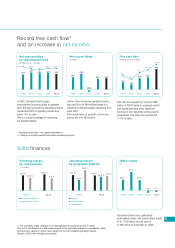
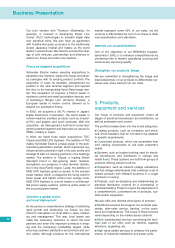
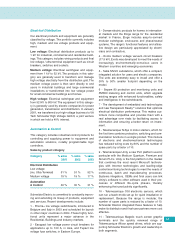
Solid finances
Operating margin
by core business
(% of sales)
Electrical Distribution
Automation & Control
12.0 %
10.3 %
12.3 %
9.6 %
2002** 2003
Operating margin
by geographic division
12.1 %
15.2 %
11.8 % 11.4 %
8.0 %
10.9 %
2002** 2003
Europe
North America
International
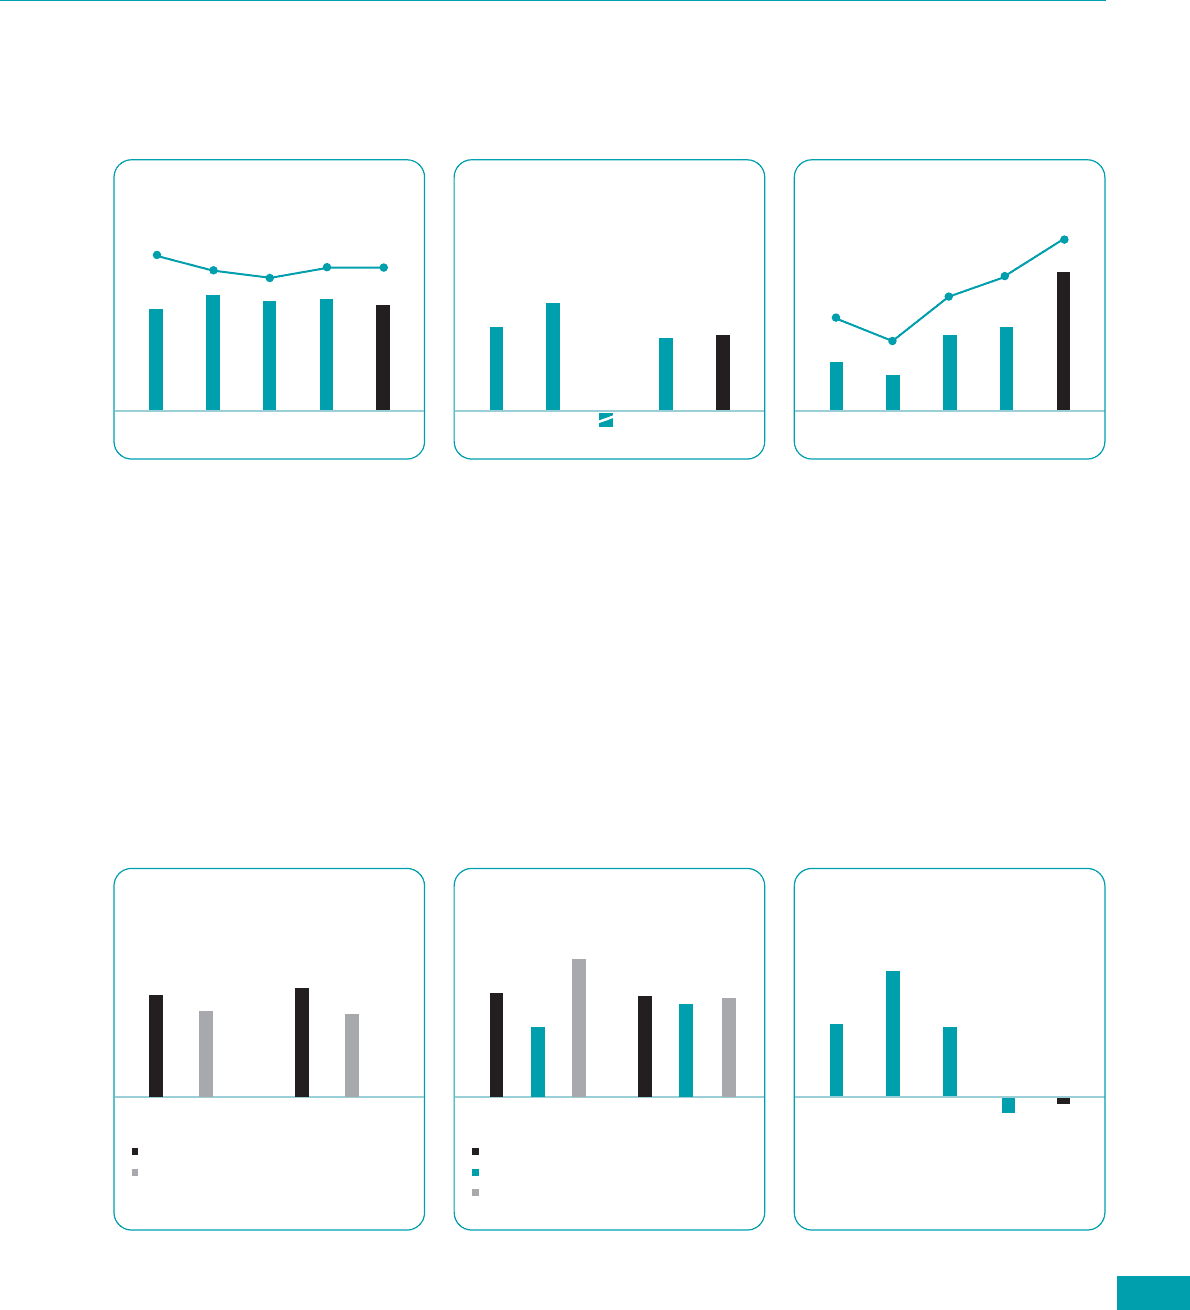
Debt to equity
(%)
28 % 27 %
47 %
-11 %
1999 2000 20022001 2003
-5 %
* Operating cash flow - net capital expenditure
+/- change in working capital and before dividend payment.
** The Company made changes in its management accounting system in 2003.
This led to modifications in the measurement of the operating margin by geographic region
and business segment, without any impact on the consolidated operating margin.
Data for 2002 were restated accordingly.
Schneider Electric has a particularly
solid balance sheet, with shareholders’ equity
of €7,734 million and net cash of
€399 million at December 31, 2003.