APC 2003 Annual Report Download - page 25
Download and view the complete annual report
Please find page 25 of the 2003 APC annual report below. You can navigate through the pages in the report by either clicking on the pages listed below, or by using the keyword search tool below to find specific information within the annual report.-
 1
1 -
2
-
3
-
4
-
5
-
6
-
7
-
8
-
9
-
10
-
11
-
12
-
13
-
14
-
 15
15 -
 16
16 -
 17
17 -
 18
18 -
 19
19 -
 20
20 -
 21
21 -
 22
22 -
 23
23 -
 24
24 -
 25
25 -
 26
26 -
 27
27 -
 28
28 -
 29
29 -
 30
30 -
 31
31 -
 32
32 -
 33
33 -
 34
34 -
 35
35 -
36
-
37
-
38
-
39
-
40
-
41
-
42
-
43
-
44
-
45
-
46
-
47
-
48
-
49
-
50
-
51
-
52
-
53
-
54
-
55
-
56
-
57
-
58
-
59
-
60
-
61
-
62
-
63
-
64
-
65
-
66
-
67
-
68
-
69
-
70
-
71
-
72
-
73
-
74
-
75
-
76
-
77
-
78
-
79
-
80
-
81
-
82
-
83
-
84
-
85
-
86
-
87
-
88
-
89
-
90
-
91
-
92
-
93
-
94
-
95
-
96
-
97
-
98
-
99
-
100
-
101
-
102
-
103
-
104
-
105
-
106
-
107
-
108
-
109
-
110
-
111
-
112
-
113
-
114
-
115
-
116
-
117
-
118
-
119
-
120
-
121
-
122
-
123
-
124
-
125
-
126
-
127
-
128
-
129
-
130
-
131
-
132
-
133
-
134
-
135
-
136
-
137
-
138
-
139
-
140
-
141
-
142
-
143
-
144
-
145
 |
 |

23
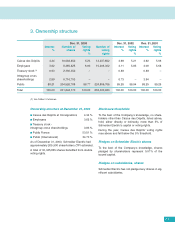
Options granted to the top ten employee grantees during the year
and exercised by the ten employees exercising the most options during the year
Number Price Expiration
of options (in euros) date
Options granted in 2003 to the top ten employee grantees
(not including corporate officers) 445,000 45.65 2011
Options exercised in 2003 by the ten employees
exercising the largest number of options during the year
(not including corporate officers) 114,860 36.03 (1) -
(1) Weighted average price (4,060 under plan 10, 18,300 under plan 11, 82,300 under plan 12, and 10,200 under plan 13).
Stock option plan details
Plan Date of Number Number Price Exercise criteria % of Number Number
no. Board of initial of options in targets of options of options
Meeting grantees granted euros met cancelled outstanding
(1) at Dec. 31,
2003 (2)
9 04/07/95 47 575,200 24.93 None
NA NA 0
10 04/07/95 134 626,800 24.93 All options: ROE for 1993 to 1995 54.4 279,600 0
11 06/13/96 233 862,800 35.37 All options: ROE for 1994 to 1996 62.5 339,700 89,950
12 01/24/97 53 1,360,000 35.67 None NA NA 27,000
13 06/10/97 273 970,800 44.52 All options: ROE for 1995 to 1997 74.9 239,400 532,210
14 01/28/98 P 287 1,208,000 50.77 All options: ROE for 1996 to 1998 85.4 164,300 997,400
(3)
15 12/22/98 P 1 60,000 50.86 50% of options: value creation
for 1999 to 2001 55.4 13,300 46,700
16 04/01/99 P 337 1,259,300 50.73 50% of options: value creation
for 1999 to 2001 55.4 245,900 928,500
(3)
17 04/01/99 P 542 2,123,100 50.73 All options: sales, base costs and
operating income for 2001 71.6
(2)
1,078,600 953,700
(3)
18 03/24/00 P 1,037 1,421,200 65.88 50% of options: value creation
for 2000 to 2002 50.0 686,600 644,650
(3)
19 04/04/01 S/P 1,050 1,557,850 68.80 None NA NA 1,485,525
(3)
20 12/12/01 180 1,600,000 51.76 All options: 2004 sales
and operating income - - 1,528,900
(3)
21 02/05/03 S/P 433 2,000,000 45.65 50% of options: operating margin and
operating income to capital employed - - 1,950,400
(3)
22 02/05/03 111 111,000 45.65 None (reserved for winners
of the NEW2004 Trophies) NA NA 93,000
15,734,050 9,277,935
(1) Because targets were not met.
(2) Number of shares outstanding after deducting all shares cancelled and exercised since the plan began.
(3) The difference between the number of options granted and the number of options outstanding stems from the cancellation of options granted to
employees who have left the Group.