APC 2003 Annual Report Download - page 103
Download and view the complete annual report
Please find page 103 of the 2003 APC annual report below. You can navigate through the pages in the report by either clicking on the pages listed below, or by using the keyword search tool below to find specific information within the annual report.-
 1
1 -
2
-
3
-
4
-
5
-
6
-
7
-
8
-
9
-
10
-
11
-
12
-
13
-
14
-
15
-
16
-
17
-
18
-
19
-
20
-
21
-
22
-
23
-
24
-
25
-
26
-
27
-
28
-
29
-
30
-
31
-
32
-
33
-
34
-
35
-
36
-
37
-
38
-
39
-
40
-
41
-
42
-
43
-
44
-
45
-
46
-
47
-
48
-
49
-
50
-
51
-
52
-
53
-
54
-
55
-
56
-
57
-
58
-
59
-
60
-
61
-
62
-
63
-
64
-
65
-
66
-
67
-
68
-
69
-
70
-
71
-
72
-
73
-
74
-
75
-
76
-
77
-
78
-
79
-
80
-
81
-
82
-
83
-
84
-
85
-
86
-
87
-
88
-
89
-
90
-
91
-
92
-
 93
93 -
 94
94 -
 95
95 -
 96
96 -
 97
97 -
 98
98 -
 99
99 -
 100
100 -
 101
101 -
 102
102 -
 103
103 -
 104
104 -
 105
105 -
 106
106 -
 107
107 -
 108
108 -
 109
109 -
 110
110 -
 111
111 -
 112
112 -
 113
113 -
114
-
115
-
116
-
117
-
118
-
119
-
120
-
121
-
122
-
123
-
124
-
125
-
126
-
127
-
128
-
129
-
130
-
131
-
132
-
133
-
134
-
135
-
136
-
137
-
138
-
139
-
140
-
141
-
142
-
143
-
144
-
145
 |
 |

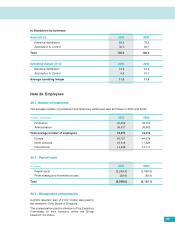
26.3 - Management compensation
In 2003, directors’ fees of € 0.57 million were paid to
the members of the Board of Directors.
The compensation paid to members of the Executive
Committee for their functions within the Group
totaled € 4.5 million.
101
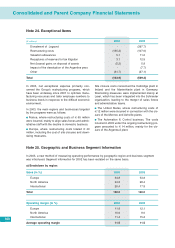
b) Breakdown by business:
Sales (in %) 2003 2002
Electrical distribution 69.5 70.3
Automation & Control 30.5 29.7
Total 100.0 100.0
Operating margin (in %) 2003 2002
Electrical distribution 12.2 12.0
Automation & Control 9.4 10.3
Average operating margin 11.5 11.5
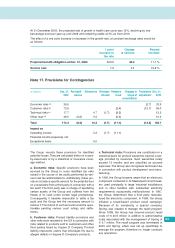
Note 26. Employees
26.1. Number of employees
The average number of permanent and temporary employees was as follows in 2003 and 2002:
(number of employees)
2003 2002
Production 35,459 36,151
Administration 38,817 38,663
Total average number of employees 74,276 74,814
Europe 43,151 44,078
North America 16,516 17,625
International 14,609 13,111
26.2 - Payroll costs
(
€
millions)
2003 2002
Payroll costs (2,959.4) (3,090.9)
Profit-sharing and incentive bonuses (38.6) (29.2)
Total (2,998.0) (3,120.1)