APC 2003 Annual Report Download - page 59
Download and view the complete annual report
Please find page 59 of the 2003 APC annual report below. You can navigate through the pages in the report by either clicking on the pages listed below, or by using the keyword search tool below to find specific information within the annual report.-
 1
1 -
2
-
3
-
4
-
5
-
6
-
7
-
8
-
9
-
10
-
11
-
12
-
13
-
14
-
15
-
16
-
17
-
18
-
19
-
20
-
21
-
22
-
23
-
24
-
25
-
26
-
27
-
28
-
29
-
30
-
31
-
32
-
33
-
34
-
35
-
36
-
37
-
38
-
39
-
40
-
41
-
42
-
43
-
44
-
45
-
46
-
47
-
48
-
 49
49 -
 50
50 -
 51
51 -
 52
52 -
 53
53 -
 54
54 -
 55
55 -
 56
56 -
 57
57 -
 58
58 -
 59
59 -
 60
60 -
 61
61 -
 62
62 -
 63
63 -
 64
64 -
 65
65 -
 66
66 -
 67
67 -
 68
68 -
 69
69 -
70
-
71
-
72
-
73
-
74
-
75
-
76
-
77
-
78
-
79
-
80
-
81
-
82
-
83
-
84
-
85
-
86
-
87
-
88
-
89
-
90
-
91
-
92
-
93
-
94
-
95
-
96
-
97
-
98
-
99
-
100
-
101
-
102
-
103
-
104
-
105
-
106
-
107
-
108
-
109
-
110
-
111
-
112
-
113
-
114
-
115
-
116
-
117
-
118
-
119
-
120
-
121
-
122
-
123
-
124
-
125
-
126
-
127
-
128
-
129
-
130
-
131
-
132
-
133
-
134
-
135
-
136
-
137
-
138
-
139
-
140
-
141
-
142
-
143
-
144
-
145
 |
 |

57
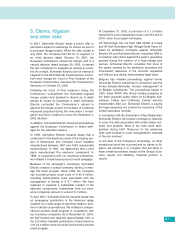
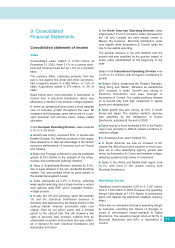
9. Consolidated
Financial Statements
Consolidated statement of income
Sales
Consolidated sales totaled € 8,780 million at
December 31, 2003, down 3.1% on a current struc-
tural and currency basis but up 1.4% on a constant
basis.
The currency effect, stemming primarily from the
euro’s rise against the dollar and other currencies,
had a negative impact of € 682 million, or 7.5% of
sales. Acquisitions added € 276 million, or 3% of
sales.
Sales trends were more favorable in Automation &
Control than in Electrical Distribution, which was
affected by a decline in the medium voltage segment.
A review by operating division gives a more detailed
view of business growth throughout the year. All
increases and decreases given below are on a con-
stant structural and currency basis, unless stated
otherwise.
In the European Operating Division, sales declined
2.1% to € 4.8 billion.
■Growth was strong, at around 20%, in Central and
Eastern Europe. Our forefront positions in this region
have allowed us to take full advantage of the vibrant
economic performance of countries such as Russia
and Ukraine.
■Spain and Portugal continued to provide sustained
growth (5.2%) thanks to the strength of the infras-
tructure and commercial buildings markets.
■Sales in Scandinavia-Benelux declined by 5.4%,
due to weak demand in the non-residential buildings
market. This was partially offset by good growth in
the residential segment (Lexel).
■Sales decreased by 5.2% in France, reflecting
weak capital spending and a sharp decline in orders
from national utility EDF, which impacted medium-
voltage projects.
■In Italy, the UK and Germany, sales fell between
1% and 6%. Electrical Distribution business in
Germany was depressed by the steady decline in the
building market, whereas automation sales rose
slightly, lifted by our action plans and a modest
upturn in the second half. The UK showed a few
signs of recovery. Italy, however, suffered from an
unfavorable economic environment that was reflect-
ed in demand for both Electrical Distribution and
Automation & Control.
In the North American Operating Division, sales
edged back 0.3% to € 2.2 billion. Sales decreased in
the US and Canada but held steady overall in
Mexico. By business, Electrical Distribution sales
rose slightly while Automation & Control sales fell
due to low capital spending.
The gradual recovery in our end markets over the
second half was amplified by the positive impact of
action plans implemented at the beginning of the
year.
Sales in the International Operating Division rose
14.5% to € 1.8 billion, with all regions contributing to
growth.
■Greater China, comprising the People’s Republic,
Hong Kong and Taiwan, delivered an exceptional
22% increase in sales. Growth was strong in
Electrical Distribution and even stronger in
Automation & Control. Our quality positions allowed
us to benefit fully from high investment in capital
goods and infrastructure.
■Sales growth was also strong, at 12%, in South
Korea and Japan. The industry market’s recovery
was amplified by the integration of Digital
Electronics, acquired at the end of 2002.
■Sales rose by a more moderate 0.8% in the Pacific
region due primarily to difficult market conditions in
medium voltage.
■In Southeast Asia, sales climbed 6%.
■In South America, we saw an increase of 9%
despite the difficult economic situation in most coun-
tries. As in other developing regions, growth was
driven by Automation & Control and medium voltage,
reflecting sustained high levels of investment.
■Sales in the Africa and Middle East region rose
13.7%, with most of this growth coming from
Electrical Distribution.
Operating income
Operating income declined 3.2% to € 1,007 million
from € 1,040 million in 2002. However, the operating
margin held steady at 11.5% thanks to productivity
gains and despite the significant negative currency
effect.
There was no noticeable change in operating margin
by business, excluding the impact of changes in
scope of consolidation linked primarily to Digital
Electronics. The operating margin stood at 12.3% in
Electrical Distribution and 9.6% in Automation &
Control.