APC 2003 Annual Report Download - page 6
Download and view the complete annual report
Please find page 6 of the 2003 APC annual report below. You can navigate through the pages in the report by either clicking on the pages listed below, or by using the keyword search tool below to find specific information within the annual report.-
 1
1 -
 2
2 -
 3
3 -
 4
4 -
 5
5 -
 6
6 -
 7
7 -
 8
8 -
 9
9 -
 10
10 -
 11
11 -
 12
12 -
 13
13 -
 14
14 -
 15
15 -
 16
16 -
 17
17 -
18
-
19
-
20
-
21
-
22
-
23
-
24
-
25
-
26
-
27
-
28
-
29
-
30
-
31
-
32
-
33
-
34
-
35
-
36
-
37
-
38
-
39
-
40
-
41
-
42
-
43
-
44
-
45
-
46
-
47
-
48
-
49
-
50
-
51
-
52
-
53
-
54
-
55
-
56
-
57
-
58
-
59
-
60
-
61
-
62
-
63
-
64
-
65
-
66
-
67
-
68
-
69
-
70
-
71
-
72
-
73
-
74
-
75
-
76
-
77
-
78
-
79
-
80
-
81
-
82
-
83
-
84
-
85
-
86
-
87
-
88
-
89
-
90
-
91
-
92
-
93
-
94
-
95
-
96
-
97
-
98
-
99
-
100
-
101
-
102
-
103
-
104
-
105
-
106
-
107
-
108
-
109
-
110
-
111
-
112
-
113
-
114
-
115
-
116
-
117
-
118
-
119
-
120
-
121
-
122
-
123
-
124
-
125
-
126
-
127
-
128
-
129
-
130
-
131
-
132
-
133
-
134
-
135
-
136
-
137
-
138
-
139
-
140
-
141
-
142
-
143
-
144
-
145
 |
 |
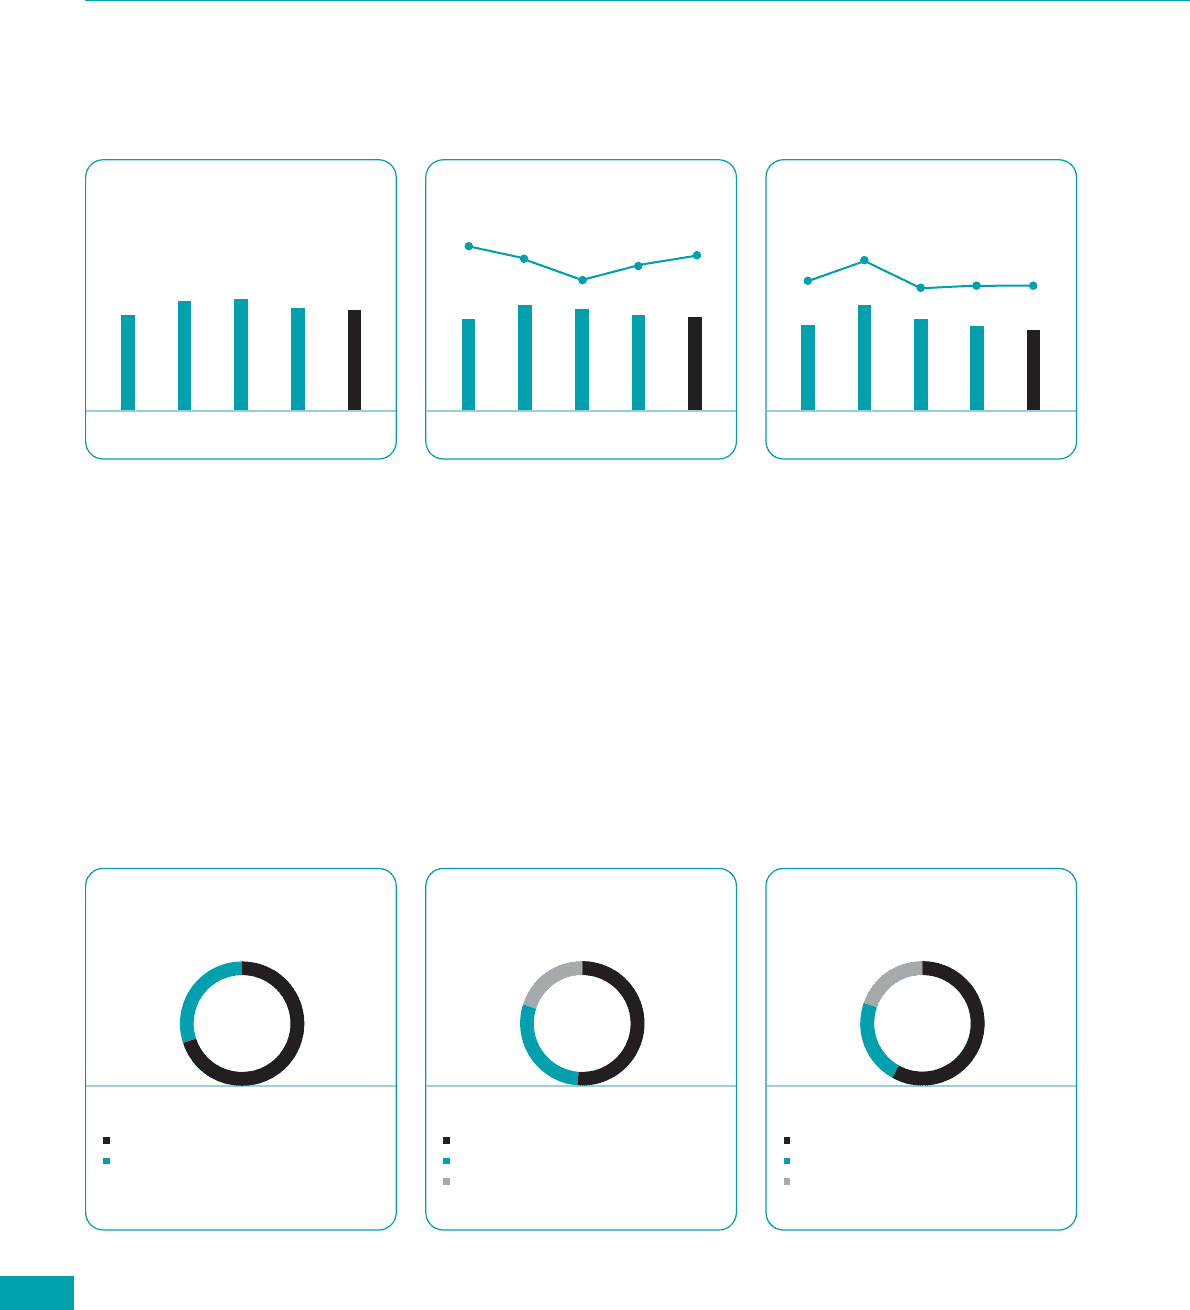
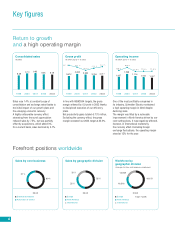
Key figures
Return to growth
and a high operating margin
4
9.06
8.38 9.70 9.83
1999 2000 20022001 2003
8.78
Consolidated sales
( billion)
Sales rose 1.4% at constant scope of
consolidation and exchange rates thanks to
the initial impact of our growth plans and
the emerging economic recovery.
A highly unfavorable currency effect
stemming from the euro’s appreciation
reduced sales by 7.5%, but was partially
offset by acquisitions, which added 3%.
On a current basis, sales declined by 3.1%.
Gross profit
( million and as % of sales)
1999 2000 20022001 2003
3,717
3,612
4,083 3,950
43.1 % 42.1 %
40.2 %
41.4 %
3,755
42.3 %
In line with NEW2004 targets, the gross
margin widened by 0.9 point in 2003 thanks
to disciplined execution of our efficiency
plans.
Net productivity gains totaled € 131 million.
Excluding the currency effect, the gross
margin exceeded our 2003 target at 42.9%.
1,057
1,298
1,116 1,040
11.5 %
11.4 %11.5 %
12.6 %
13.4 %
1,007
Operating income
( million and as % of sales)
1999 2000 20022001 2003
One of the most profitable companies in
its industry, Schneider Electric maintained
a high operating margin in 2003 despite
declining sales.
The margin was lifted by a noticeable
improvement in North America driven by our
cost-cutting plans. It was negatively affected,
however, in International markets by
the currency effect. Excluding foreign
exchange fluctuations, the operating margin
stood at 13% for the year.
Forefront positions worldwide
Sales by core business
2003
31 %
69 %
Electrical distribution
Automation & Control
Sales by geographic division
2003
20 %
55 %
25 %
Europe
North America
International
Workforce by
geographic division
(Average full-time and temporary employees)
2003
Total: 74,276
14,609
43,151
16,516
Europe
North America
International