APC 2003 Annual Report Download - page 52
Download and view the complete annual report
Please find page 52 of the 2003 APC annual report below. You can navigate through the pages in the report by either clicking on the pages listed below, or by using the keyword search tool below to find specific information within the annual report.-
 1
1 -
2
-
3
-
4
-
5
-
6
-
7
-
8
-
9
-
10
-
11
-
12
-
13
-
14
-
15
-
16
-
17
-
18
-
19
-
20
-
21
-
22
-
23
-
24
-
25
-
26
-
27
-
28
-
29
-
30
-
31
-
32
-
33
-
34
-
35
-
36
-
37
-
38
-
39
-
40
-
41
-
 42
42 -
 43
43 -
 44
44 -
 45
45 -
 46
46 -
 47
47 -
 48
48 -
 49
49 -
 50
50 -
 51
51 -
 52
52 -
 53
53 -
 54
54 -
 55
55 -
 56
56 -
 57
57 -
 58
58 -
 59
59 -
 60
60 -
 61
61 -
 62
62 -
63
-
64
-
65
-
66
-
67
-
68
-
69
-
70
-
71
-
72
-
73
-
74
-
75
-
76
-
77
-
78
-
79
-
80
-
81
-
82
-
83
-
84
-
85
-
86
-
87
-
88
-
89
-
90
-
91
-
92
-
93
-
94
-
95
-
96
-
97
-
98
-
99
-
100
-
101
-
102
-
103
-
104
-
105
-
106
-
107
-
108
-
109
-
110
-
111
-
112
-
113
-
114
-
115
-
116
-
117
-
118
-
119
-
120
-
121
-
122
-
123
-
124
-
125
-
126
-
127
-
128
-
129
-
130
-
131
-
132
-
133
-
134
-
135
-
136
-
137
-
138
-
139
-
140
-
141
-
142
-
143
-
144
-
145
 |
 |

Business Review
50
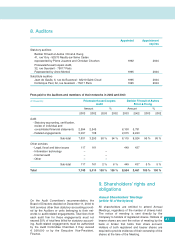
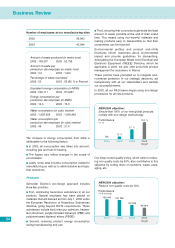
This data is then reconciled with information from
accounting and purchasing reporting systems to
ensure consistency.
All of the workforce and environmental data covers
the Company as a whole, unless stated otherwise.
The NEW2004 indicators are published quarterly.
Statistics defined in France’s NRE legislation are
also presented here.
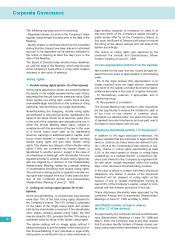
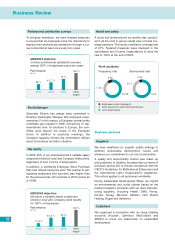
Social and societal performance
Employees
We focus on deploying consistent policies to improve
managerial efficiency and on promoting behavior that
enhances employability, equity and good health.
Workforce data
2003 at 2002 2003
scope of
consolidation
Average workforce 71,245 74,276
Temporary and
permanent contracts
at Dec. 31, 2003 69,965 71,850
New hires 9,535 9,924
Departures 9,145 11,996
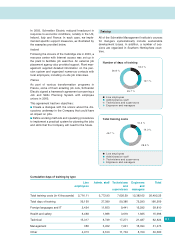
Total payroll costs at December 31, 2003:
€2,915,820.
Men / Women
65.6 %
34.4 %
● Men ● Women
(2003 data at 2002
scope of consolidation: 65% - 35%)
Category
29 %
27 %
44 %
● Engineers and managers
● Non-executive staff and technicians
● Line employees
(2003 data at 2002
scope of consolidation: 25.7% - 28.3% - 46%)
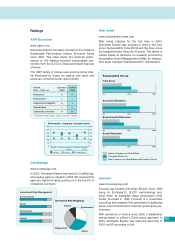
Age
26 %
10.3 %
6.2 %
29.2 %
28.3 %
● < 25
● 25 - 34 years
● 35 - 44 years
● 45 - 54 years
● > 55 years
Seniority
21.5 %
15 %
2.8 %
29.3 %
31.4 %
● < 5 years
● 5 - 15 years
● 16 - 24 years
● 25 - 34 years
● > 35 years
Breakdown by Operating Division
20 %
58 %
22 %
● North America
● Europe
● International