APC 2003 Annual Report Download - page 27
Download and view the complete annual report
Please find page 27 of the 2003 APC annual report below. You can navigate through the pages in the report by either clicking on the pages listed below, or by using the keyword search tool below to find specific information within the annual report.-
 1
1 -
2
-
3
-
4
-
5
-
6
-
7
-
8
-
9
-
10
-
11
-
12
-
13
-
14
-
15
-
16
-
 17
17 -
 18
18 -
 19
19 -
 20
20 -
 21
21 -
 22
22 -
 23
23 -
 24
24 -
 25
25 -
 26
26 -
 27
27 -
 28
28 -
 29
29 -
 30
30 -
 31
31 -
 32
32 -
 33
33 -
 34
34 -
 35
35 -
 36
36 -
 37
37 -
38
-
39
-
40
-
41
-
42
-
43
-
44
-
45
-
46
-
47
-
48
-
49
-
50
-
51
-
52
-
53
-
54
-
55
-
56
-
57
-
58
-
59
-
60
-
61
-
62
-
63
-
64
-
65
-
66
-
67
-
68
-
69
-
70
-
71
-
72
-
73
-
74
-
75
-
76
-
77
-
78
-
79
-
80
-
81
-
82
-
83
-
84
-
85
-
86
-
87
-
88
-
89
-
90
-
91
-
92
-
93
-
94
-
95
-
96
-
97
-
98
-
99
-
100
-
101
-
102
-
103
-
104
-
105
-
106
-
107
-
108
-
109
-
110
-
111
-
112
-
113
-
114
-
115
-
116
-
117
-
118
-
119
-
120
-
121
-
122
-
123
-
124
-
125
-
126
-
127
-
128
-
129
-
130
-
131
-
132
-
133
-
134
-
135
-
136
-
137
-
138
-
139
-
140
-
141
-
142
-
143
-
144
-
145
 |
 |

25
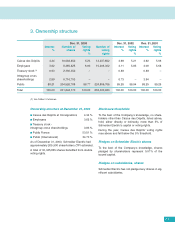
6. Stock market data
The Schneider Electric SA share is listed on the
Euronext First Market in Paris, where it is traded in
lots of one under ISIN code FR0000121972.
It is part of the market’s benchmark CAC 40 index of
France’s largest stocks.
18-Month Trading Data
Year Month Trading Value Price
volume (in millions (in euros)
(in thousands of euros)
of shares) High Low
2002 September 18,268 832.86 50.05 41.10
October 25,555 1,114.80 48.78 37.16
November 25,571 1,233.54 50.00 44.55
December 23,345 1,109.33 50.35 43.11
2003 January 24,259 1,101.49 49.89 39.69
February 22,615 907.56 43.00 38.42
March 24,322 1,046.00 46.75 38.70
April 29,351 1,274.94 46.29 41.20
May 35,818 1,439.42 43.07 37.40
June 31,909 1,312.49 43.25 38.02
July 27,412 1,207.38 47.00 41.85
August 26,392 1,275.25 50.20 46.80
September 22,939 1,108.11 51.00 44.50
October 20,399 966.40 50.60 44.60
November 24,354 1,252.56 53.00 49.70
December 18,842 990.11 54.30 51.20
Total 2003 305,505 13,748.99
2004 January 26,457 1,394.70 55.95 49.71
February 20,017 1,068.16 55.30 51.50
Five-year Summary of Share-Price Performance
2003 2002 2001 2000 1999
Average daily trading volume
Euronext Paris
- Thousands of shares 1,198.06 1,068.17 1,206.92 528.64 590.42
- Millions of euros 53.92 53.87 72.82 38.50 35.31
High and low share prices (in euros)
- High 54.30 59.85 79.20 85.80 78.00
- Low 37.40 37.16 38.10 57.35 44.40
Year-end closing price (in euros) 51.90 45.09 54.00 77.70 77.95
Yield including tax credit (%) 3.18 3.33 2.41 3.09 2.58