APC 2003 Annual Report Download - page 62
Download and view the complete annual report
Please find page 62 of the 2003 APC annual report below. You can navigate through the pages in the report by either clicking on the pages listed below, or by using the keyword search tool below to find specific information within the annual report.-
 1
1 -
2
-
3
-
4
-
5
-
6
-
7
-
8
-
9
-
10
-
11
-
12
-
13
-
14
-
15
-
16
-
17
-
18
-
19
-
20
-
21
-
22
-
23
-
24
-
25
-
26
-
27
-
28
-
29
-
30
-
31
-
32
-
33
-
34
-
35
-
36
-
37
-
38
-
39
-
40
-
41
-
42
-
43
-
44
-
45
-
46
-
47
-
48
-
49
-
50
-
51
-
 52
52 -
 53
53 -
 54
54 -
 55
55 -
 56
56 -
 57
57 -
 58
58 -
 59
59 -
 60
60 -
 61
61 -
 62
62 -
 63
63 -
 64
64 -
 65
65 -
 66
66 -
 67
67 -
 68
68 -
 69
69 -
 70
70 -
 71
71 -
 72
72 -
73
-
74
-
75
-
76
-
77
-
78
-
79
-
80
-
81
-
82
-
83
-
84
-
85
-
86
-
87
-
88
-
89
-
90
-
91
-
92
-
93
-
94
-
95
-
96
-
97
-
98
-
99
-
100
-
101
-
102
-
103
-
104
-
105
-
106
-
107
-
108
-
109
-
110
-
111
-
112
-
113
-
114
-
115
-
116
-
117
-
118
-
119
-
120
-
121
-
122
-
123
-
124
-
125
-
126
-
127
-
128
-
129
-
130
-
131
-
132
-
133
-
134
-
135
-
136
-
137
-
138
-
139
-
140
-
141
-
142
-
143
-
144
-
145
 |
 |

Business Review
60
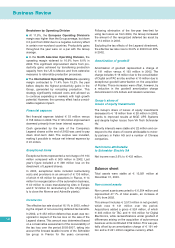
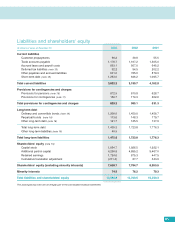
Other short-term liabilities
Other short-term liabilities primarily include trade
accounts payable, other payables and accrued liabil-
ities, accrued taxes and payroll costs, and deferred
tax liabilities. Together, they represent 18.9% of the
balance sheet total and rose 3% over the year to
€2,629 million.
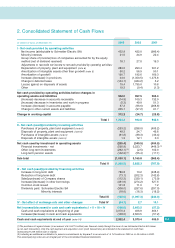
Consolidated statement
of cash flows
The consolidated statement of cash flows breaks
down cash used or provided by different activities
during the year.
Operating activities
Net cash provided by operating activities before
changes in operating assets and liabilities totaled
€942 million, or a stable 10.7% of sales.
Changes in working capital came to € 312 million,
primarily reflecting changes in tax assets and liabili-
ties in France and the US.
Total net cash provided by operating activities
amounted to € 1,254 million, up 34.4% from € 933
million the year before.
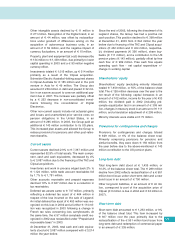
Investing activities
Net cash used by investment in operating assets
amounted to € 265 million versus € 341 million in
2002. Purchases of intangible assets and of proper-
ty, plant and equipment decreased by € 63 million
while disposals increased by € 12 million. The Group
has put an emphasis on investing in production facil-
ities in emerging markets.
Net financial investments used € 596 million, where-
as the divestment of Legrand shares provided
€3,224 million in 2002. The main investments during
the year included TAC (€ 385 million) and Clipsal
(€185 million), along with an increase in Schneider
Electric’s interest in MGE UPS Systems (€ 15 mil-
lion).
Other long-term investments correspond to a loan to
Clipsal Australia in an amount of € 259 million.
Long-term pension assets correspond to a € 143
million contribution to pension plans in the US.
In all, investing activities used € 1,265 million in 2003
after providing € 2,825 million in 2002. Excluding the
divestment of Legrand shares, investing activities
used € 651 million in 2002.
Financing activities
Increases in long-term debt net of reductions came
to € 717 million. In October, the Group issued € 750
million worth of 3.875% bonds due October 2008.
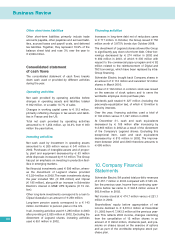
The divestment of Legrand shares allowed the Group
to significantly pay down short-term debt. Other bor-
rowings decreased by € 274 million in 2002 and
€482 million in 2003, of which € 335 million with
respect to the commercial paper program and € 82
million related to the reimbursement of Digital and
TAC borrowings, which have been replaced by intra-
Group financing.
Schneider Electric bought back Company shares in
an amount of € 112 million and cancelled 12 million
shares in March 2003.
A total of € 102 million in common stock was issued
on the exercise of stock options and to serve the
worldwide employee stock purchase plan.
Dividends paid totaled € 327 million (including the
précompte equalization tax), of which € 19 million to
minority interests.
Over the year, financing activities used a total of
€102 million versus € 1,097 million in 2002.
At December 31, cash and cash equivalents
decreased by € 168 million after increasing by
€2,663 million in 2002 as a result of the divestment
of the Company’s Legrand shares. Excluding this
exceptional item, cash and cash equivalents
decreased by € 813 million in 2002. The improve-
ment between 2002 and 2003 therefore amounts to
€ 686 million.
10. Company Financial
Statements
Schneider Electric SA posted total portfolio revenues
of € 457.7 million in 2003 compared with € 545 mil-
lion the previous year. Income from continuing oper-
ations before tax came to € 542.8 million versus €
563.8 million in 2002.
Net income stood at € 474.7 million versus € 221.1
million in 2002.
Shareholders’ equity before appropriation of net
income declined to € 6,813.4 million at December
31, 2003 from € 7,043.3 million at the previous year-
end. This reflects 2003 income, changes stemming
from the cancellation of 12 million shares in an
amount of € 490.2 million, dividends paid, and pre-
miums on shares issued on the exercise of options
and as part of the worldwide employee stock pur-
chase plan.