APC 2003 Annual Report Download - page 64
Download and view the complete annual report
Please find page 64 of the 2003 APC annual report below. You can navigate through the pages in the report by either clicking on the pages listed below, or by using the keyword search tool below to find specific information within the annual report.-
 1
1 -
2
-
3
-
4
-
5
-
6
-
7
-
8
-
9
-
10
-
11
-
12
-
13
-
14
-
15
-
16
-
17
-
18
-
19
-
20
-
21
-
22
-
23
-
24
-
25
-
26
-
27
-
28
-
29
-
30
-
31
-
32
-
33
-
34
-
35
-
36
-
37
-
38
-
39
-
40
-
41
-
42
-
43
-
44
-
45
-
46
-
47
-
48
-
49
-
50
-
51
-
52
-
53
-
 54
54 -
 55
55 -
 56
56 -
 57
57 -
 58
58 -
 59
59 -
 60
60 -
 61
61 -
 62
62 -
 63
63 -
 64
64 -
 65
65 -
 66
66 -
 67
67 -
 68
68 -
 69
69 -
 70
70 -
 71
71 -
 72
72 -
 73
73 -
 74
74 -
75
-
76
-
77
-
78
-
79
-
80
-
81
-
82
-
83
-
84
-
85
-
86
-
87
-
88
-
89
-
90
-
91
-
92
-
93
-
94
-
95
-
96
-
97
-
98
-
99
-
100
-
101
-
102
-
103
-
104
-
105
-
106
-
107
-
108
-
109
-
110
-
111
-
112
-
113
-
114
-
115
-
116
-
117
-
118
-
119
-
120
-
121
-
122
-
123
-
124
-
125
-
126
-
127
-
128
-
129
-
130
-
131
-
132
-
133
-
134
-
135
-
136
-
137
-
138
-
139
-
140
-
141
-
142
-
143
-
144
-
145
 |
 |

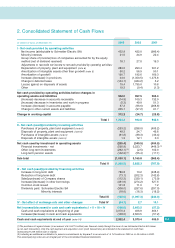
62
Consolidated and Parent Company Financial Statements
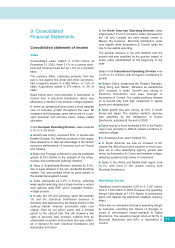
1. Consolidated Statement of Income
(in millions of euros except for earnings per share)
2003 2002 2001
Sales 8,780.3 9,060.5 9,828.2
Cost of sales (5,063.1) (5,305.2) (5,878.6)
Research and development expenses (494.0) (472.7) (512.7)
Selling, general and administrative expenses (2,215.8) (2,242.9) (2,320.6)
Operating income 1,007.4 1,039.6 1,116.3
Financial expense, net
(note 23)
(53.1) (157.8) (120.9)
Income from continuing operations before tax 954.3 881.9 995.4
Exceptional items
(note 24)
(163.9) (509.2) (1,563.9)
Income tax
(note 13)
(127.3) 295.0 (206.9)
Net income/(loss) of fully consolidated companies
before amortization of goodwill 663.1 667.7 (775.4)
Amortization of goodwill
(note 4)
(190.7) (192.6) (169.3)
Group's share of income/(loss) of equity investments
(note 7)
(18.1) (28.2) (19.3)
Net income/(loss) before minority interests 454.3 446.9 (964.0)
Minority interests (21.5) (24.9) (22.4)
Net income/(loss) (attributable to Schneider Electric SA) 432.8 422.0 (986.4)
Earnings/(loss) per share (in euros)
(note 15.6)
1.94 1.85 (5.43)
Diluted earnings/(loss) per share (in euros)) 1.94 1.84 (5.43)
The accompanying notes are an integral part of the consolidated financial statements