APC 2003 Annual Report Download - page 102
Download and view the complete annual report
Please find page 102 of the 2003 APC annual report below. You can navigate through the pages in the report by either clicking on the pages listed below, or by using the keyword search tool below to find specific information within the annual report.-
 1
1 -
2
-
3
-
4
-
5
-
6
-
7
-
8
-
9
-
10
-
11
-
12
-
13
-
14
-
15
-
16
-
17
-
18
-
19
-
20
-
21
-
22
-
23
-
24
-
25
-
26
-
27
-
28
-
29
-
30
-
31
-
32
-
33
-
34
-
35
-
36
-
37
-
38
-
39
-
40
-
41
-
42
-
43
-
44
-
45
-
46
-
47
-
48
-
49
-
50
-
51
-
52
-
53
-
54
-
55
-
56
-
57
-
58
-
59
-
60
-
61
-
62
-
63
-
64
-
65
-
66
-
67
-
68
-
69
-
70
-
71
-
72
-
73
-
74
-
75
-
76
-
77
-
78
-
79
-
80
-
81
-
82
-
83
-
84
-
85
-
86
-
87
-
88
-
89
-
90
-
91
-
 92
92 -
 93
93 -
 94
94 -
 95
95 -
 96
96 -
 97
97 -
 98
98 -
 99
99 -
 100
100 -
 101
101 -
 102
102 -
 103
103 -
 104
104 -
 105
105 -
 106
106 -
 107
107 -
 108
108 -
 109
109 -
 110
110 -
 111
111 -
 112
112 -
113
-
114
-
115
-
116
-
117
-
118
-
119
-
120
-
121
-
122
-
123
-
124
-
125
-
126
-
127
-
128
-
129
-
130
-
131
-
132
-
133
-
134
-
135
-
136
-
137
-
138
-
139
-
140
-
141
-
142
-
143
-
144
-
145
 |
 |

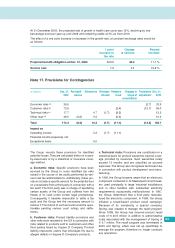
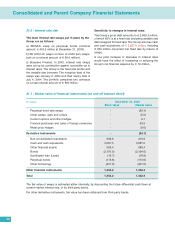
In 2003, net exceptional expense primarily con-
cerned the Group’s restructuring programs, which
have been underway since 2001 to optimize manu-
facturing resources and tailor employee numbers to
business levels in response to the difficult economic
environment.
In 2003, the main regions and businesses targeted
by the programs were as follows:
■France, where restructuring costs of €65 million
were incurred, mainly to align sales forces and admin-
istrative staff with the decline in domestic business.
■Europe, where restructuring costs totaled €40
million, including the cost of site closures and down-
sizing measures.
Site closure costs concerned the Celbridge plant in
Ireland and the Marienhiede plant in Germany.
Downsizing measures were implemented mainly at
Lexel, which has been integrated into the Schneider
organization, leading to the merger of sales forces
and administrative teams.
■The United States, where restructuring costs of
€12 million were incurred in connection with the clo-
sure of the Monroe and Ashville plants.
■The Automation & Control business. The costs
incurred in 2003 under the ongoing restructuring pro-
gram amounted to €14 million, mainly for the clo-
sure of the Argenteuil plant.
Consolidated and Parent Company Financial Statements
100
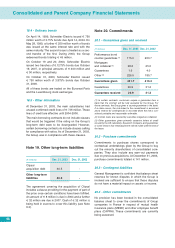
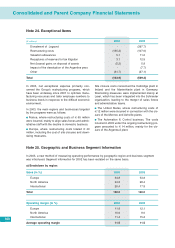
Note 24. Exceptional Items
(
€
millions)
2003 2002
Divestment of Legrand - (397.7)
Restructuring costs (135.2) (107.0)
Valuation allowances 5.1 11.6
Recaptures of reserves for tax litigation 3.1 12.9
Net (losses) gains on disposal of assets (5.2) 5.8
Impact of the devaluation of the Argentine peso - (7.7)
Other (31.7) (27.1)
Total (163.9) (509.2)
Note 25. Geographic and Business Segment Information
In 2003, a new method of measuring operating performance by geographic region and business segment
was introduced. Segment information for 2002 has been restated on the same basis.
a) Breakdown by region:
Sales (in %) 2003 2002
Europe 54.8 53.8
North America 24.8 28.4
International 20.4 17.8
Total 100.0 100.0
Operating margin (in %) 2003 2002
Europe 11.8 12.1
North America 10.9 8.0
International 11.4 15.2
Average operating margin 11.5 11.5