APC 2003 Annual Report Download - page 93
Download and view the complete annual report
Please find page 93 of the 2003 APC annual report below. You can navigate through the pages in the report by either clicking on the pages listed below, or by using the keyword search tool below to find specific information within the annual report.-
 1
1 -
2
-
3
-
4
-
5
-
6
-
7
-
8
-
9
-
10
-
11
-
12
-
13
-
14
-
15
-
16
-
17
-
18
-
19
-
20
-
21
-
22
-
23
-
24
-
25
-
26
-
27
-
28
-
29
-
30
-
31
-
32
-
33
-
34
-
35
-
36
-
37
-
38
-
39
-
40
-
41
-
42
-
43
-
44
-
45
-
46
-
47
-
48
-
49
-
50
-
51
-
52
-
53
-
54
-
55
-
56
-
57
-
58
-
59
-
60
-
61
-
62
-
63
-
64
-
65
-
66
-
67
-
68
-
69
-
70
-
71
-
72
-
73
-
74
-
75
-
76
-
77
-
78
-
79
-
80
-
81
-
82
-
 83
83 -
 84
84 -
 85
85 -
 86
86 -
 87
87 -
 88
88 -
 89
89 -
 90
90 -
 91
91 -
 92
92 -
 93
93 -
 94
94 -
 95
95 -
 96
96 -
 97
97 -
 98
98 -
 99
99 -
 100
100 -
 101
101 -
 102
102 -
 103
103 -
104
-
105
-
106
-
107
-
108
-
109
-
110
-
111
-
112
-
113
-
114
-
115
-
116
-
117
-
118
-
119
-
120
-
121
-
122
-
123
-
124
-
125
-
126
-
127
-
128
-
129
-
130
-
131
-
132
-
133
-
134
-
135
-
136
-
137
-
138
-
139
-
140
-
141
-
142
-
143
-
144
-
145
 |
 |

91
(
€
millions)
O/w US plans O/w US plans
Dec. 31, 2003
Dec. 31, 2003
Dec. 31, 2002
Dec. 31, 2002
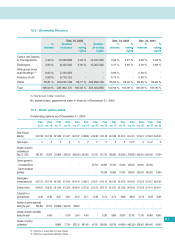
4. Change in fair value of plan assets
Fair value of plan assets at
beginning of year 914.8
610.5
1 170.7
819.4
Actual return on plan assets 170.4
139.9
(131.4)
(99.3)
Plan participants’ contributions 3.6 3.0 -
Employer contributions 161.6
143.4
59.6
53.6
Prior service cost (0.3) - - -
Acquisitions – Disposals (*) 7.8 - - -
Benefits paid (61.3)
(37.7)
(52.7)
(41.0)
Translation adjustment (188.9)
(129.8)
(134.4)
(122.3)
Fair value of plan assets at end of year 1,007.7
726.3
914.8
610.5
(*) Acquisitions in 2003 concerned Digital Electronics Corp. and TAC.
(
€
millions)
O/w US plans O/w US plans
Dec. 31, 2003
Dec. 31, 2003
Dec. 31, 2002
Dec. 31, 2002
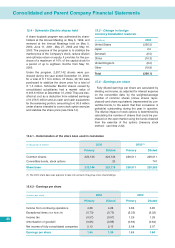
5. Funded status
Funded status (560.6)
(33.8)
(685.1)
(245.6)
Unrecognized actuarial (gains)/losses 449.0
290.2
545.9
419.3
Unrecognized prior service cost 28.0
25.5
33.0
32.3
Unrecognized initial liability (1.7) (0.9)
(0.9)
Net (liability)/asset recognized (85.3)
281.9
(107.0)
205.0
Benefit obligations and periodic pension costs were determined using the following assumptions:
(
€
millions)
Weighted average rate
O/w US plans
2003 2002 2003 2002
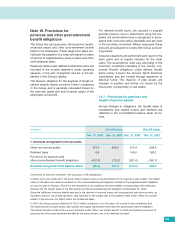
6. Actuarial assumptions
Discount rate 5.75 % 6.3 %
6.5 % 7.0 %
Rate of compensation increases 3.8 % 3.9 %
4.1 % 4.6 %
Yield on plan assets 8.5 % 9.0 %
9.0 % 9.5 %