APC 2012 Annual Report Download - page 10
Download and view the complete annual report
Please find page 10 of the 2012 APC annual report below. You can navigate through the pages in the report by either clicking on the pages listed below, or by using the keyword search tool below to find specific information within the annual report.-
 1
1 -
 2
2 -
 3
3 -
 4
4 -
 5
5 -
 6
6 -
 7
7 -
 8
8 -
 9
9 -
 10
10 -
 11
11 -
 12
12 -
 13
13 -
 14
14 -
 15
15 -
 16
16 -
 17
17 -
 18
18 -
 19
19 -
 20
20 -
 21
21 -
22
-
23
-
24
-
25
-
26
-
27
-
28
-
29
-
30
-
31
-
32
-
33
-
34
-
35
-
36
-
37
-
38
-
39
-
40
-
41
-
42
-
43
-
44
-
45
-
46
-
47
-
48
-
49
-
50
-
51
-
52
-
53
-
54
-
55
-
56
-
57
-
58
-
59
-
60
-
61
-
62
-
63
-
64
-
65
-
66
-
67
-
68
-
69
-
70
-
71
-
72
-
73
-
74
-
75
-
76
-
77
-
78
-
79
-
80
-
81
-
82
-
83
-
84
-
85
-
86
-
87
-
88
-
89
-
90
-
91
-
92
-
93
-
94
-
95
-
96
-
97
-
98
-
99
-
100
-
101
-
102
-
103
-
104
-
105
-
106
-
107
-
108
-
109
-
110
-
111
-
112
-
113
-
114
-
115
-
116
-
117
-
118
-
119
-
120
-
121
-
122
-
123
-
124
-
125
-
126
-
127
-
128
-
129
-
130
-
131
-
132
-
133
-
134
-
135
-
136
-
137
-
138
-
139
-
140
-
141
-
142
-
143
-
144
-
145
-
146
-
147
-
148
-
149
-
150
-
151
-
152
-
153
-
154
-
155
-
156
-
157
-
158
-
159
-
160
-
161
-
162
-
163
-
164
-
165
-
166
-
167
-
168
-
169
-
170
-
171
-
172
-
173
-
174
-
175
-
176
-
177
-
178
-
179
-
180
-
181
-
182
-
183
-
184
-
185
-
186
-
187
-
188
-
189
-
190
-
191
-
192
-
193
-
194
-
195
-
196
-
197
-
198
-
199
-
200
-
201
-
202
-
203
-
204
-
205
-
206
-
207
-
208
-
209
-
210
-
211
-
212
-
213
-
214
-
215
-
216
-
217
-
218
-
219
-
220
-
221
-
222
-
223
-
224
-
225
-
226
-
227
-
228
-
229
-
230
-
231
-
232
-
233
-
234
-
235
-
236
-
237
-
238
-
239
-
240
-
241
-
242
-
243
-
244
-
245
-
246
-
247
-
248
-
249
-
250
-
251
-
252
-
253
-
254
-
255
-
256
-
257
-
258
-
259
-
260
-
261
-
262
-
263
-
264
-
265
-
266
-
267
-
268
-
269
-
270
-
271
-
272
-
273
-
274
-
275
-
276
-
277
-
278
-
279
-
280
-
281
-
282
-
283
-
284
-
285
-
286
-
287
-
288
-
289
-
290
-
291
-
292
-
293
-
294
-
295
-
296
-
297
-
298
-
299
-
300
-
301
-
302
-
303
-
304
-
305
-
306
-
307
-
308
-
309
-
310
-
311
-
312
-
313
-
314
-
315
-
316
-
317
-
318
-
319
-
320
 |
 |

2012 REGISTRATION DOCUMENT SCHNEIDER ELECTRIC8
KEY FIGURES 2012
>
Key figures 2012
SCHNEIDER ELECTRIC
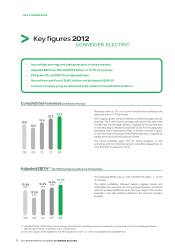
• Record high earnings and cash generation in mixed markets
• Adjusted EBITA up 10% at EUR3.5billion, or 14.7% of revenues
• EPS grew 11%, at EUR3.73 on adjusted basis
• Record free cash flow of EUR2.1billion and dividend of EUR1.87
• Connect company program delivered solid results in line with 2014 ambition
Consolidated revenues (in billions of euros)
11
22.3
08
18.3
09
15.8
10
19.6
12
23.9 Revenues were up 7% on a current structure and exchange rate
basis and down 0.7% like-for-like.
2012 organic growth trends remained contrasted by region and by
business. The IT and Power business posted growth this year, while
Industry saw the strongest decline, impacted by the general drop
in manufacturing in Western Europe and China. From a geographic
standpoint, North America and Rest of World continued to grow.
On the other hand, Europe and Asia Pacifi c were down, respectively
impacted by the south of Europe and China.
The Group benefi ted again from its strong presence in new
economies and from Solutions growth, accounting respectively for
41% and 39% of revenues in 2012.
Adjusted EBITA (1) (in millions of euros and as a % of revenues)
(1) Adjusted EBITA: EBITA before restructuring costs and other operating income and expenses (one time items such as capital gains/losses,
pension gains/losses, acquisition costs, impairments).
11(2)
08 09 10
15.9%
2,910
13.0%
2,048
15.4%
3,019
14.3%
3,190
12
14.7%
3,515
2012 adjusted EBITA was up 10% to EUR3,515million, or 14.7%
of revenues .
The higher profi tability, achieved despite negative volume and
unfavorable mix, was driven by strong pricing discipline, continuous
push for operational effi ciency and improving margin of the solution
business, in line with ambitions defi ned in the Connect company
program.
(2) The 2011 fi gures were restated for the item disclosed in note 1.2 of the consolidated fi nancial statements.