APC 2012 Annual Report Download - page 158
Download and view the complete annual report
Please find page 158 of the 2012 APC annual report below. You can navigate through the pages in the report by either clicking on the pages listed below, or by using the keyword search tool below to find specific information within the annual report.-
 1
1 -
2
-
3
-
4
-
5
-
6
-
7
-
8
-
9
-
10
-
11
-
12
-
13
-
14
-
15
-
16
-
17
-
18
-
19
-
20
-
21
-
22
-
23
-
24
-
25
-
26
-
27
-
28
-
29
-
30
-
31
-
32
-
33
-
34
-
35
-
36
-
37
-
38
-
39
-
40
-
41
-
42
-
43
-
44
-
45
-
46
-
47
-
48
-
49
-
50
-
51
-
52
-
53
-
54
-
55
-
56
-
57
-
58
-
59
-
60
-
61
-
62
-
63
-
64
-
65
-
66
-
67
-
68
-
69
-
70
-
71
-
72
-
73
-
74
-
75
-
76
-
77
-
78
-
79
-
80
-
81
-
82
-
83
-
84
-
85
-
86
-
87
-
88
-
89
-
90
-
91
-
92
-
93
-
94
-
95
-
96
-
97
-
98
-
99
-
100
-
101
-
102
-
103
-
104
-
105
-
106
-
107
-
108
-
109
-
110
-
111
-
112
-
113
-
114
-
115
-
116
-
117
-
118
-
119
-
120
-
121
-
122
-
123
-
124
-
125
-
126
-
127
-
128
-
129
-
130
-
131
-
132
-
133
-
134
-
135
-
136
-
137
-
138
-
139
-
140
-
141
-
142
-
143
-
144
-
145
-
146
-
147
-
 148
148 -
 149
149 -
 150
150 -
 151
151 -
 152
152 -
 153
153 -
 154
154 -
 155
155 -
 156
156 -
 157
157 -
 158
158 -
 159
159 -
 160
160 -
 161
161 -
 162
162 -
 163
163 -
 164
164 -
 165
165 -
 166
166 -
 167
167 -
 168
168 -
169
-
170
-
171
-
172
-
173
-
174
-
175
-
176
-
177
-
178
-
179
-
180
-
181
-
182
-
183
-
184
-
185
-
186
-
187
-
188
-
189
-
190
-
191
-
192
-
193
-
194
-
195
-
196
-
197
-
198
-
199
-
200
-
201
-
202
-
203
-
204
-
205
-
206
-
207
-
208
-
209
-
210
-
211
-
212
-
213
-
214
-
215
-
216
-
217
-
218
-
219
-
220
-
221
-
222
-
223
-
224
-
225
-
226
-
227
-
228
-
229
-
230
-
231
-
232
-
233
-
234
-
235
-
236
-
237
-
238
-
239
-
240
-
241
-
242
-
243
-
244
-
245
-
246
-
247
-
248
-
249
-
250
-
251
-
252
-
253
-
254
-
255
-
256
-
257
-
258
-
259
-
260
-
261
-
262
-
263
-
264
-
265
-
266
-
267
-
268
-
269
-
270
-
271
-
272
-
273
-
274
-
275
-
276
-
277
-
278
-
279
-
280
-
281
-
282
-
283
-
284
-
285
-
286
-
287
-
288
-
289
-
290
-
291
-
292
-
293
-
294
-
295
-
296
-
297
-
298
-
299
-
300
-
301
-
302
-
303
-
304
-
305
-
306
-
307
-
308
-
309
-
310
-
311
-
312
-
313
-
314
-
315
-
316
-
317
-
318
-
319
-
320
 |
 |

2012 REGISTRATION DOCUMENT SCHNEIDER ELECTRIC156
BUSINESS REVIEW
4REVIEW OF THE CONSOLIDATED FINANCIAL STATEMENTS
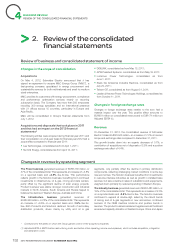
Earnings per share
Earnings per share increased to EUR3.39 for the year ended
December31, 2012 from EUR3.34 for the year ended December31,
2011 (taking into account the division of the nominal value of the
shares by two, effective as of September2, 2011).
Before goodwill impairment of Buildings CGU of EUR183million
after tax effect in2012 (and EUR15million of goodwill impairment
in 2011), earnings per share amounted to EUR3.73 for the year
ended December 31, 2012, an increase of 11.0% compared to
EUR3.36 for the year ended December31, 2011.
Consolidated cash-flow
Operating Activities
Net cash provided by operating activities before changes in operating
assets and liabilities reached EUR2,802million for the year ended
December31, 2012, up 10.4% compared to EUR2,537million for
the year ended December 31, 2011, and represented 11.7% of
revenue in2012 compared with 11.4% in2011.
Change in working capital requirement consumed EUR1 million
in cash in the year ended December 31, 2012, compared
to EUR285 million in consumption in the year ended
December 31,2011, in the framework of Connect initiatives to
improve inventory management.
In all, net cash provided by operating activities increased 24.4%
from EUR2,252million in the year ended December31, 2011 to
EUR2,801million in the year ended December31, 2012.
Investing Activities
Net capital expenditure, which included capitalized development
projects, decreased 3.6% to EUR719 million for the year ended
December 31, 2012, compared to EUR746 million for the year
ended December31, 2011, and represented 3.0% of revenues.
Our acquisitions represented a cash outfl ow, net of cash acquired,
of EUR242 million for the year ended December 31, 2012,
corresponding partially to M&C, compared to EUR2,873 million
in the year ended December 31, 2011 corresponding mainly to
acquisitions of Telvent, Luminous, Leader&Harvest and Summit.
The proceeds from sale of fi nancial assets in2012 correspond to the
proceeds net of fees of the sale of AXA shares in September2012.
Financing Activities
The bond issuance of EUR601 million corresponds to a
USD800 million bond issue in September 2012 due 2022 in
the United States, by way of a private placement to institutional
investors only (including to qualifi ed institutional buyers in the United
States) at 2.95% fi xed rate.
The net decrease in other fi nancial debts amount to
EUR585 million during the year ended December 31, 2012,
compared to an increase of EUR432million during the year ended
December31,2011. The dividend paid by Schneider Electric was
EUR919million the year ended December31, 2012, compared
with EUR856million the year ended December31, 2011.