APC 2012 Annual Report Download - page 200
Download and view the complete annual report
Please find page 200 of the 2012 APC annual report below. You can navigate through the pages in the report by either clicking on the pages listed below, or by using the keyword search tool below to find specific information within the annual report.-
 1
1 -
2
-
3
-
4
-
5
-
6
-
7
-
8
-
9
-
10
-
11
-
12
-
13
-
14
-
15
-
16
-
17
-
18
-
19
-
20
-
21
-
22
-
23
-
24
-
25
-
26
-
27
-
28
-
29
-
30
-
31
-
32
-
33
-
34
-
35
-
36
-
37
-
38
-
39
-
40
-
41
-
42
-
43
-
44
-
45
-
46
-
47
-
48
-
49
-
50
-
51
-
52
-
53
-
54
-
55
-
56
-
57
-
58
-
59
-
60
-
61
-
62
-
63
-
64
-
65
-
66
-
67
-
68
-
69
-
70
-
71
-
72
-
73
-
74
-
75
-
76
-
77
-
78
-
79
-
80
-
81
-
82
-
83
-
84
-
85
-
86
-
87
-
88
-
89
-
90
-
91
-
92
-
93
-
94
-
95
-
96
-
97
-
98
-
99
-
100
-
101
-
102
-
103
-
104
-
105
-
106
-
107
-
108
-
109
-
110
-
111
-
112
-
113
-
114
-
115
-
116
-
117
-
118
-
119
-
120
-
121
-
122
-
123
-
124
-
125
-
126
-
127
-
128
-
129
-
130
-
131
-
132
-
133
-
134
-
135
-
136
-
137
-
138
-
139
-
140
-
141
-
142
-
143
-
144
-
145
-
146
-
147
-
148
-
149
-
150
-
151
-
152
-
153
-
154
-
155
-
156
-
157
-
158
-
159
-
160
-
161
-
162
-
163
-
164
-
165
-
166
-
167
-
168
-
169
-
170
-
171
-
172
-
173
-
174
-
175
-
176
-
177
-
178
-
179
-
180
-
181
-
182
-
183
-
184
-
185
-
186
-
187
-
188
-
189
-
 190
190 -
 191
191 -
 192
192 -
 193
193 -
 194
194 -
 195
195 -
 196
196 -
 197
197 -
 198
198 -
 199
199 -
 200
200 -
 201
201 -
 202
202 -
 203
203 -
 204
204 -
 205
205 -
 206
206 -
 207
207 -
 208
208 -
 209
209 -
 210
210 -
211
-
212
-
213
-
214
-
215
-
216
-
217
-
218
-
219
-
220
-
221
-
222
-
223
-
224
-
225
-
226
-
227
-
228
-
229
-
230
-
231
-
232
-
233
-
234
-
235
-
236
-
237
-
238
-
239
-
240
-
241
-
242
-
243
-
244
-
245
-
246
-
247
-
248
-
249
-
250
-
251
-
252
-
253
-
254
-
255
-
256
-
257
-
258
-
259
-
260
-
261
-
262
-
263
-
264
-
265
-
266
-
267
-
268
-
269
-
270
-
271
-
272
-
273
-
274
-
275
-
276
-
277
-
278
-
279
-
280
-
281
-
282
-
283
-
284
-
285
-
286
-
287
-
288
-
289
-
290
-
291
-
292
-
293
-
294
-
295
-
296
-
297
-
298
-
299
-
300
-
301
-
302
-
303
-
304
-
305
-
306
-
307
-
308
-
309
-
310
-
311
-
312
-
313
-
314
-
315
-
316
-
317
-
318
-
319
-
320
 |
 |

2012 REGISTRATION DOCUMENT SCHNEIDER ELECTRIC198
CONSOLIDATED FINANCIAL STATEMENTS AT DECEMBER31, 2012
5NOTES TO THE CONSOLIDATED FINANCIAL STATEMENTS
To exercise the options granted under plans26 to33, and the SARs,
the grantee must be an employee or corporate offi cer of the Group.
In addition, exercise of some options is generally conditional on the
achievement of annual objectives based on fi nancial indicators.
In respect of subscription vesting conditions for current stock
option plans, Schneider ElectricSA has created 2,952,154shares
in2012.
Change in the number of stock grants
Plan no. Number of stock grants
atDec.31, 2011 Number of existing or new
shares grants in2012 Number of shares
cancelledin2012 Number of shares
outstanding at Dec.31, 2012
4
5 272,830 (272,830)
6 393,748 (30,952) 362,796
7 2,500 (2,500)
8 317,962 (317,962)
9 750,410 (3,600) (32,920) 713,890
10 661,980 (4,028) 657,952
11 1,136,076 (2,324) (26,926) 1,106,826
10 bis 3,000 3,000
11 bis 5,882 5,882
12 19,850 19,850
13 645,443 2,500 (1,200) 646,743
13 ter 625 625
14 1,387,800 (1,575) (31,839) 1,354,386
14 ter 1,500 (900) 600
TOTAL 5,597,481 (596,166) (128,765) 4,872,550
For stock grants to vest, the grantee must be an employee or corporate offi cer of the Group. In addition, vesting of some stock grants is
conditional on the achievement of annual objectives based on fi nancial indicators.
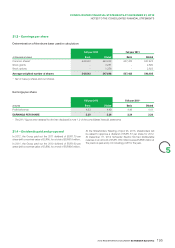
21.5.1 Valuation of share-based payments
Stock option valuation
In accordance with the accounting policies described in note1.20,
the stock option plans have been valued on the basis of an average
estimated life of between seven and ten years using the following
assumptions:
•expected volatility of between 20% and 28%, corresponding to
capped historical volatility;
•a payout rate of between 3.0% and 4.5%;
•a discount rate of between 2.9% and 4.5%, corresponding to a
risk-free rate over the life of the plans (source: Bloomberg).
Based on these assumptions, the amount recorded under “Selling, general and administrative expenses” for stock grant plans set up after
November7, 2002 breaks down as follows:
Full year 2012 Full year 2011
Plan 30 -1
Plan 31 12
Plan 32 --
Plan 33 34
TOTAL 47