APC 2012 Annual Report Download - page 238
Download and view the complete annual report
Please find page 238 of the 2012 APC annual report below. You can navigate through the pages in the report by either clicking on the pages listed below, or by using the keyword search tool below to find specific information within the annual report.-
 1
1 -
2
-
3
-
4
-
5
-
6
-
7
-
8
-
9
-
10
-
11
-
12
-
13
-
14
-
15
-
16
-
17
-
18
-
19
-
20
-
21
-
22
-
23
-
24
-
25
-
26
-
27
-
28
-
29
-
30
-
31
-
32
-
33
-
34
-
35
-
36
-
37
-
38
-
39
-
40
-
41
-
42
-
43
-
44
-
45
-
46
-
47
-
48
-
49
-
50
-
51
-
52
-
53
-
54
-
55
-
56
-
57
-
58
-
59
-
60
-
61
-
62
-
63
-
64
-
65
-
66
-
67
-
68
-
69
-
70
-
71
-
72
-
73
-
74
-
75
-
76
-
77
-
78
-
79
-
80
-
81
-
82
-
83
-
84
-
85
-
86
-
87
-
88
-
89
-
90
-
91
-
92
-
93
-
94
-
95
-
96
-
97
-
98
-
99
-
100
-
101
-
102
-
103
-
104
-
105
-
106
-
107
-
108
-
109
-
110
-
111
-
112
-
113
-
114
-
115
-
116
-
117
-
118
-
119
-
120
-
121
-
122
-
123
-
124
-
125
-
126
-
127
-
128
-
129
-
130
-
131
-
132
-
133
-
134
-
135
-
136
-
137
-
138
-
139
-
140
-
141
-
142
-
143
-
144
-
145
-
146
-
147
-
148
-
149
-
150
-
151
-
152
-
153
-
154
-
155
-
156
-
157
-
158
-
159
-
160
-
161
-
162
-
163
-
164
-
165
-
166
-
167
-
168
-
169
-
170
-
171
-
172
-
173
-
174
-
175
-
176
-
177
-
178
-
179
-
180
-
181
-
182
-
183
-
184
-
185
-
186
-
187
-
188
-
189
-
190
-
191
-
192
-
193
-
194
-
195
-
196
-
197
-
198
-
199
-
200
-
201
-
202
-
203
-
204
-
205
-
206
-
207
-
208
-
209
-
210
-
211
-
212
-
213
-
214
-
215
-
216
-
217
-
218
-
219
-
220
-
221
-
222
-
223
-
224
-
225
-
226
-
227
-
 228
228 -
 229
229 -
 230
230 -
 231
231 -
 232
232 -
 233
233 -
 234
234 -
 235
235 -
 236
236 -
 237
237 -
 238
238 -
 239
239 -
 240
240 -
 241
241 -
 242
242 -
 243
243 -
 244
244 -
 245
245 -
 246
246 -
 247
247 -
 248
248 -
249
-
250
-
251
-
252
-
253
-
254
-
255
-
256
-
257
-
258
-
259
-
260
-
261
-
262
-
263
-
264
-
265
-
266
-
267
-
268
-
269
-
270
-
271
-
272
-
273
-
274
-
275
-
276
-
277
-
278
-
279
-
280
-
281
-
282
-
283
-
284
-
285
-
286
-
287
-
288
-
289
-
290
-
291
-
292
-
293
-
294
-
295
-
296
-
297
-
298
-
299
-
300
-
301
-
302
-
303
-
304
-
305
-
306
-
307
-
308
-
309
-
310
-
311
-
312
-
313
-
314
-
315
-
316
-
317
-
318
-
319
-
320
 |
 |

2012 REGISTRATION DOCUMENT SCHNEIDER ELECTRIC236
COMPANY FINANCIAL STATEMENTS
6NOTES TO THE FINANCIAL STATEMENTS
Currency risk
Where necessary, a contingency provision is in place for unrealised
exchange losses. However, where there are unrealised exchange
gains and losses on back-to-back transactions in the same
currency and with the same maturity, the amount of the provision is
then limited to the net loss.
Bonds
Redemption premiums and issue costs are amortised over the life
of the bonds.
Note1
Non-current assets
1.1 – Intangible assets
This item primarily consists of share issue and merger expenses, which are fully amortised.
1.2 – Tangible assets
Tangible assets Dec.31, 2011 Additions Disposals Dec.31, 2012
Cost 4,470 - (10) 4,460
Depreciation (290) - - (290)
NET 4,180 - (10) 4,170
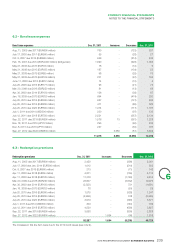
Note2
Investments
2.1 – Shares in subsidiaries and affiliates
Shares in subsidiaries and affi liates Dec.31, 2011 Additions Disposals Dec.31, 2012
Cost 4,607,212 5 (1,458) 4,605,759
Provisions (17,896) (89,067) 1,458 (105,505)
NET 4,589,316 (89,062) - 4,500,254
The main changes over the fi nancial year are mainly related to the impairment of its investments in Cofi bel for EUR63million, Cofi mines for
EUR8million and for Schneider Electric Japon for EUR18million.
The main investments at December31, 2012 were as follows:
Shares in subsidiaries and affi liates Carrying value
Schneider Electric IndustriesSAS 4,344,481
Cofi bel 74,647
Cofi mines 74,256
Schneider Electric Japan Holding 3,149
Other (less than EUR20million) 3,721
TOTAL 4,500,254