APC 2012 Annual Report Download - page 201
Download and view the complete annual report
Please find page 201 of the 2012 APC annual report below. You can navigate through the pages in the report by either clicking on the pages listed below, or by using the keyword search tool below to find specific information within the annual report.-
 1
1 -
2
-
3
-
4
-
5
-
6
-
7
-
8
-
9
-
10
-
11
-
12
-
13
-
14
-
15
-
16
-
17
-
18
-
19
-
20
-
21
-
22
-
23
-
24
-
25
-
26
-
27
-
28
-
29
-
30
-
31
-
32
-
33
-
34
-
35
-
36
-
37
-
38
-
39
-
40
-
41
-
42
-
43
-
44
-
45
-
46
-
47
-
48
-
49
-
50
-
51
-
52
-
53
-
54
-
55
-
56
-
57
-
58
-
59
-
60
-
61
-
62
-
63
-
64
-
65
-
66
-
67
-
68
-
69
-
70
-
71
-
72
-
73
-
74
-
75
-
76
-
77
-
78
-
79
-
80
-
81
-
82
-
83
-
84
-
85
-
86
-
87
-
88
-
89
-
90
-
91
-
92
-
93
-
94
-
95
-
96
-
97
-
98
-
99
-
100
-
101
-
102
-
103
-
104
-
105
-
106
-
107
-
108
-
109
-
110
-
111
-
112
-
113
-
114
-
115
-
116
-
117
-
118
-
119
-
120
-
121
-
122
-
123
-
124
-
125
-
126
-
127
-
128
-
129
-
130
-
131
-
132
-
133
-
134
-
135
-
136
-
137
-
138
-
139
-
140
-
141
-
142
-
143
-
144
-
145
-
146
-
147
-
148
-
149
-
150
-
151
-
152
-
153
-
154
-
155
-
156
-
157
-
158
-
159
-
160
-
161
-
162
-
163
-
164
-
165
-
166
-
167
-
168
-
169
-
170
-
171
-
172
-
173
-
174
-
175
-
176
-
177
-
178
-
179
-
180
-
181
-
182
-
183
-
184
-
185
-
186
-
187
-
188
-
189
-
190
-
 191
191 -
 192
192 -
 193
193 -
 194
194 -
 195
195 -
 196
196 -
 197
197 -
 198
198 -
 199
199 -
 200
200 -
 201
201 -
 202
202 -
 203
203 -
 204
204 -
 205
205 -
 206
206 -
 207
207 -
 208
208 -
 209
209 -
 210
210 -
 211
211 -
212
-
213
-
214
-
215
-
216
-
217
-
218
-
219
-
220
-
221
-
222
-
223
-
224
-
225
-
226
-
227
-
228
-
229
-
230
-
231
-
232
-
233
-
234
-
235
-
236
-
237
-
238
-
239
-
240
-
241
-
242
-
243
-
244
-
245
-
246
-
247
-
248
-
249
-
250
-
251
-
252
-
253
-
254
-
255
-
256
-
257
-
258
-
259
-
260
-
261
-
262
-
263
-
264
-
265
-
266
-
267
-
268
-
269
-
270
-
271
-
272
-
273
-
274
-
275
-
276
-
277
-
278
-
279
-
280
-
281
-
282
-
283
-
284
-
285
-
286
-
287
-
288
-
289
-
290
-
291
-
292
-
293
-
294
-
295
-
296
-
297
-
298
-
299
-
300
-
301
-
302
-
303
-
304
-
305
-
306
-
307
-
308
-
309
-
310
-
311
-
312
-
313
-
314
-
315
-
316
-
317
-
318
-
319
-
320
 |
 |

2012 REGISTRATION DOCUMENT SCHNEIDER ELECTRIC 199
CONSOLIDATED FINANCIAL STATEMENTS AT DECEMBER31, 2012
5
NOTES TO THE CONSOLIDATED FINANCIAL STATEMENTS
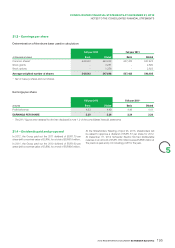
Valuation of stock grants
In accordance with the accounting policies described in note1.20,
the stock grant plans have been valued on the basis of an average
estimated life of between four and fi ve years using the following
assumptions:
•a payout rate of between 3.0% and 4.5%;
•a discount rate of between 1.6% and 4.5%, corresponding to a
risk-free rate over the life of the plans (source: Bloomberg).
Based on these assumptions, the amount recorded under “Selling, general and administrative expenses” for stock grant plans set up after
November7, 2002 breaks down as follows:
Full year 2012 Full year 2011
Plan 5 -2
Plan 6 12
Plan 7 --
Plan 8 -5
Plan 9 56
Plan 10 14 16
Plan 11 12 13
Plan 10 bis --
Plan 11 bis --
Plan 12 --
Plan 13 11 -
Plan 14 10 -
TOTAL 53 44
21.5.2 Worldwide Employee Stock Purchase Plan
Schneider Electric gives its employees the opportunity to become
group shareholders thanks to employee share issues. Employees
in countries that meet legal and fi scal requirements have the choice
between a classic and a leveraged plan.
Under the classic plan, employees may purchase Schneider
Electric shares at a 15% to20% discount to the price quoted for
the shares on the stock market. Employees must then hold their
shares for fi ve years, except in certain cases provided for by law.
The share-based payment expense recorded in accordance with
IFRS2 is measured by reference to the fair value of the discount on
the locked-up shares. The lock-up cost is determined on the basis
of a two-step strategy that involves fi rst selling the locked-up shares
on the forward market and then purchasing the same number of
shares on the spot market (i.e., shares that may be sold at any time)
using a bullet loan.
This strategy is designed to refl ect the cost that, the employee
would incur during the lock-up period to avoid the risk of carrying
the shares subscribed under the classic plan. The borrowing cost
corresponds to the cost of borrowing for the employees concerned,
as they are the sole potential buyers in this market. It is based on
the average interest rate charged by banks for an ordinary, non-
revolving personal loan with a maximum maturity of fi ve years
granted to an individual with an average credit rating.
Under the leveraged plan, employees may also purchase Schneider
Electric shares at a 15% to20% discount from the price quoted on
the stock market. However, the leveraged plan offers a different yield
profi le as a third-party bank tops up the employee’s initial investment,
essentially multiplying the amount paid by the employee. The total
is invested in Schneider Electric shares at a preferential price. The
bank converts the discount transferred by the employee into funds
with a view to securing the yield for the employee and increasing the
indexation on a leveraged number (factor of 4.4 in2012) of directly
subscribed shares.
As with the classic plan, the share-based payment expense is
determined by reference to the fair value of the discount on the
locked-up shares (see above). In addition, it includes the value of the
benefi t corresponding to the issuer’s involvement in the plan, which
means that employees have access to share prices with a volatility
profi le adapted to institutional investors rather than to the prices and
volatility profi le they would have been offered if they had purchased
the shares through their retail banks. The volatility differential is
treated as a discount equivalent that refl ects the opportunity gain
offered to employees under the leveraged plan.
As regards the fi rst semester 2012, Schneider Electric offers to
its employees the opportunity to purchase shares at a price of
EUR36.66 or EUR34.50 per share, depending on the country, as
part of its commitment to employee share ownership, on June14,
2012. This represented a 15% to20% discount to the reference
price of EUR43.12 calculated as the average opening price quoted
for the share during the 20 days preceding the Management
Board’s decision to launch the employee share issue.
Altogether, 3.5 million shares were subscribed, increasing the
Company’s capital by EUR124 million as of July 19, 2012. Due
to signifi cant changes in valuation assumptions, specifi cally the
interest rate available to market participant, the value of the lock-up
period is higher than the discount cost. Therefore the Group did not
recognize any cost related to the transaction.