APC 2012 Annual Report Download - page 269
Download and view the complete annual report
Please find page 269 of the 2012 APC annual report below. You can navigate through the pages in the report by either clicking on the pages listed below, or by using the keyword search tool below to find specific information within the annual report.-
 1
1 -
2
-
3
-
4
-
5
-
6
-
7
-
8
-
9
-
10
-
11
-
12
-
13
-
14
-
15
-
16
-
17
-
18
-
19
-
20
-
21
-
22
-
23
-
24
-
25
-
26
-
27
-
28
-
29
-
30
-
31
-
32
-
33
-
34
-
35
-
36
-
37
-
38
-
39
-
40
-
41
-
42
-
43
-
44
-
45
-
46
-
47
-
48
-
49
-
50
-
51
-
52
-
53
-
54
-
55
-
56
-
57
-
58
-
59
-
60
-
61
-
62
-
63
-
64
-
65
-
66
-
67
-
68
-
69
-
70
-
71
-
72
-
73
-
74
-
75
-
76
-
77
-
78
-
79
-
80
-
81
-
82
-
83
-
84
-
85
-
86
-
87
-
88
-
89
-
90
-
91
-
92
-
93
-
94
-
95
-
96
-
97
-
98
-
99
-
100
-
101
-
102
-
103
-
104
-
105
-
106
-
107
-
108
-
109
-
110
-
111
-
112
-
113
-
114
-
115
-
116
-
117
-
118
-
119
-
120
-
121
-
122
-
123
-
124
-
125
-
126
-
127
-
128
-
129
-
130
-
131
-
132
-
133
-
134
-
135
-
136
-
137
-
138
-
139
-
140
-
141
-
142
-
143
-
144
-
145
-
146
-
147
-
148
-
149
-
150
-
151
-
152
-
153
-
154
-
155
-
156
-
157
-
158
-
159
-
160
-
161
-
162
-
163
-
164
-
165
-
166
-
167
-
168
-
169
-
170
-
171
-
172
-
173
-
174
-
175
-
176
-
177
-
178
-
179
-
180
-
181
-
182
-
183
-
184
-
185
-
186
-
187
-
188
-
189
-
190
-
191
-
192
-
193
-
194
-
195
-
196
-
197
-
198
-
199
-
200
-
201
-
202
-
203
-
204
-
205
-
206
-
207
-
208
-
209
-
210
-
211
-
212
-
213
-
214
-
215
-
216
-
217
-
218
-
219
-
220
-
221
-
222
-
223
-
224
-
225
-
226
-
227
-
228
-
229
-
230
-
231
-
232
-
233
-
234
-
235
-
236
-
237
-
238
-
239
-
240
-
241
-
242
-
243
-
244
-
245
-
246
-
247
-
248
-
249
-
250
-
251
-
252
-
253
-
254
-
255
-
256
-
257
-
258
-
 259
259 -
 260
260 -
 261
261 -
 262
262 -
 263
263 -
 264
264 -
 265
265 -
 266
266 -
 267
267 -
 268
268 -
 269
269 -
 270
270 -
 271
271 -
 272
272 -
 273
273 -
 274
274 -
 275
275 -
 276
276 -
 277
277 -
 278
278 -
 279
279 -
280
-
281
-
282
-
283
-
284
-
285
-
286
-
287
-
288
-
289
-
290
-
291
-
292
-
293
-
294
-
295
-
296
-
297
-
298
-
299
-
300
-
301
-
302
-
303
-
304
-
305
-
306
-
307
-
308
-
309
-
310
-
311
-
312
-
313
-
314
-
315
-
316
-
317
-
318
-
319
-
320
 |
 |

2012 REGISTRATION DOCUMENT SCHNEIDER ELECTRIC 267
GENERAL PRESENTATION OF SCHNEIDER ELECTRICSA
7
STOCK MARKET DATA
>
7. Disclosure of information required in
accordance witharticleL.225-100-3
oftheFrench Commercial Code**
Items that could have an impact in the event of a public tender offer
include:
•agreements calling for payments to the members of the
Management Board or to employees if they resign or are
terminated without real cause or if their employment ends due to
a public tender offer (see pages 136 and 137 );
•agreements entered into by the Company with change of
control clauses: information on the exercise of stock options
and performance shares grants (see page 261 ); information on
certain loans and credit facilities (see page 37 );
•restrictions in the articles of association on the exercise of voting
rights (see page 254 ) relating to the non-application of the ceiling
on voting rights when a public tender offer is in process.
>
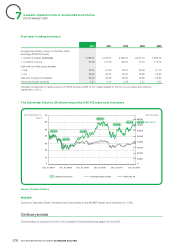
8. Stock market data
In France, Schneider Electric is listed on Euronext Paris (sub-fund A), where it is traded on a per-share basis under ISIN code FR0000121972.
Schneider ElectricSA shares are included on the CAC40 index established by Euronext.
18-month trading data in Paris
Year Month Trading volume
(inthousands) (1)
Capital traded
(inmillions of euros) High (2) Low (2)
Number of trading
sessions
2011 Sep-11 63,191 2,626 47.40 35.94 22
Oct-11 50,244 2,160 47.60 37.48 21
Nov-11 50,276 1,982 43.19 35.00 22
Dec-11 38,399 1,553 43.12 37.01 21
2012 Jan-12 44,997 2,066 49.77 40.31 22
Feb-12 37,502 1,838 51.98 45.86 21
Mar-12 40,099 2,022 53.47 48.40 22
Apr-12 43,253 2,035 49.88 44.83 19
May-12 54,551 2,392 47.90 41.21 22
Jun-12 54,922 2,332 45.08 39.40 21
Jul-12 40,225 1,761 47.50 41.22 22
Aug-12 35,407 1,758 52.32 46.46 23
Sep-12 39,558 1,970 53.39 46.06 20
Oct-12 34,771 1,690 50.70 45.85 23
Nov-12 30,115 1,526 54.80 47.96 22
Dec-12 27,624 1,487 56.37 53.25 19
TOTAL 2012 483,023 22,876 56.37 39.40 256
2013 Jan-13 23,958 1,335 57.17 54.11 22
Feb-13 31 ,838 1, 795 60 .00 53 .50 20
The data corresponds to trading volumes on NYSE Euronext.
(1) August 2011 restated for the two-for-one share split, effective September 2, 2011.
(2) During the trading session.