APC 2012 Annual Report Download - page 173
Download and view the complete annual report
Please find page 173 of the 2012 APC annual report below. You can navigate through the pages in the report by either clicking on the pages listed below, or by using the keyword search tool below to find specific information within the annual report.-
 1
1 -
2
-
3
-
4
-
5
-
6
-
7
-
8
-
9
-
10
-
11
-
12
-
13
-
14
-
15
-
16
-
17
-
18
-
19
-
20
-
21
-
22
-
23
-
24
-
25
-
26
-
27
-
28
-
29
-
30
-
31
-
32
-
33
-
34
-
35
-
36
-
37
-
38
-
39
-
40
-
41
-
42
-
43
-
44
-
45
-
46
-
47
-
48
-
49
-
50
-
51
-
52
-
53
-
54
-
55
-
56
-
57
-
58
-
59
-
60
-
61
-
62
-
63
-
64
-
65
-
66
-
67
-
68
-
69
-
70
-
71
-
72
-
73
-
74
-
75
-
76
-
77
-
78
-
79
-
80
-
81
-
82
-
83
-
84
-
85
-
86
-
87
-
88
-
89
-
90
-
91
-
92
-
93
-
94
-
95
-
96
-
97
-
98
-
99
-
100
-
101
-
102
-
103
-
104
-
105
-
106
-
107
-
108
-
109
-
110
-
111
-
112
-
113
-
114
-
115
-
116
-
117
-
118
-
119
-
120
-
121
-
122
-
123
-
124
-
125
-
126
-
127
-
128
-
129
-
130
-
131
-
132
-
133
-
134
-
135
-
136
-
137
-
138
-
139
-
140
-
141
-
142
-
143
-
144
-
145
-
146
-
147
-
148
-
149
-
150
-
151
-
152
-
153
-
154
-
155
-
156
-
157
-
158
-
159
-
160
-
161
-
162
-
 163
163 -
 164
164 -
 165
165 -
 166
166 -
 167
167 -
 168
168 -
 169
169 -
 170
170 -
 171
171 -
 172
172 -
 173
173 -
 174
174 -
 175
175 -
 176
176 -
 177
177 -
 178
178 -
 179
179 -
 180
180 -
 181
181 -
 182
182 -
 183
183 -
184
-
185
-
186
-
187
-
188
-
189
-
190
-
191
-
192
-
193
-
194
-
195
-
196
-
197
-
198
-
199
-
200
-
201
-
202
-
203
-
204
-
205
-
206
-
207
-
208
-
209
-
210
-
211
-
212
-
213
-
214
-
215
-
216
-
217
-
218
-
219
-
220
-
221
-
222
-
223
-
224
-
225
-
226
-
227
-
228
-
229
-
230
-
231
-
232
-
233
-
234
-
235
-
236
-
237
-
238
-
239
-
240
-
241
-
242
-
243
-
244
-
245
-
246
-
247
-
248
-
249
-
250
-
251
-
252
-
253
-
254
-
255
-
256
-
257
-
258
-
259
-
260
-
261
-
262
-
263
-
264
-
265
-
266
-
267
-
268
-
269
-
270
-
271
-
272
-
273
-
274
-
275
-
276
-
277
-
278
-
279
-
280
-
281
-
282
-
283
-
284
-
285
-
286
-
287
-
288
-
289
-
290
-
291
-
292
-
293
-
294
-
295
-
296
-
297
-
298
-
299
-
300
-
301
-
302
-
303
-
304
-
305
-
306
-
307
-
308
-
309
-
310
-
311
-
312
-
313
-
314
-
315
-
316
-
317
-
318
-
319
-
320
 |
 |

2012 REGISTRATION DOCUMENT SCHNEIDER ELECTRIC 171
CONSOLIDATED FINANCIAL STATEMENTS AT DECEMBER31, 2012
5
NOTES TO THE CONSOLIDATED FINANCIAL STATEMENTS
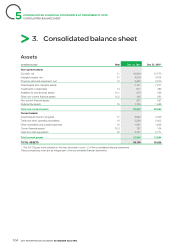
(in millions of euros)
Dec.31, 2011
published Restatement Dec.31, 2011
restated
Equity
Share capital 2,196 2,196
Additional paid-in capital 6,690 6,690
Retained earnings 6,864 (45) 6,819
Translation reserve 148 148
Equity attributable to owners of the parent 15,898 (45) 15,853
Non-controlling interests 192 192
Total equity 16,090 (45) 16,045
Total non-current liabilities 10,509 10,509
Current liabilities
Trade and other operating payables 4,094 4,094
Accrued taxes and payroll costs 2,320 (13) 2,307
Current provisions 960 960
Other current liabilities 803 803
Current debt 1,110 1,110
Total current liabilities 9,287 (13) 9,274
TOTAL EQUITY AND LIABILITIES 35,886 (58) 35,828
The effect of the restatement on the 2011 statement of changes in equity is as follows:
(in millions of euros except for
number of shares)
Number
of shares
(thousands) Capital
Additional
paid-in
capital Treasury
shares Retained
earnings Translation
reserve
Equity
Attributable
to owners of
the parent Non-control-
ling interests Total
Dec.31, 2011 published 548,943 2,196 6,690 (74) 6,938 148 15,898 192 16,090
Restatement (45) (45) (45)
Dec.31, 2011 restated 548,943 2,196 6,690 (74) 6,893 148 15,853 192 16,045
1.3 – Basis of presentation
The fi nancial statements have been prepared on a historical cost
basis, with the exception of derivative instruments and available-for-
sale fi nancial assets, which are measured at fair value. Financial
liabilities are measured using the amortized cost model. The book
value of hedged assets and liabilities, under fair-value hedge,
corresponds to their fair value, for the part corresponding to the
hedged risk.
1.4 – Use of estimates and assumptions
The preparation of fi nancial statements requires Group and
subsidiary management to make estimates and assumptions
that are refl ected in the amounts of assets and liabilities reported
in the consolidated balance sheet, the revenues and expenses in
the statement of income and the obligations created during the
reporting period. Actual results may differ.
These assumptions mainly concern:
•the measurement of the recoverable amount of goodwill,
property, plant and equipment and intangible assets (note1.11)
and the measurement of the goodwill impairment (note8);
•the measurement of the recoverable amount of non-current
fi nancial asset (note1.12 and note15);
•the realizable value of inventories and work in process (note1.13);
•the recoverable amount of accounts receivable (note1.14);
•the valuation of share-based payments (note1.20);
•the calculation of provisions for contingencies, in particular for
warranties (note1.21);
•the measurement of pension and other post-employment benefi t
obligations (note22 ).