APC 2012 Annual Report Download - page 207
Download and view the complete annual report
Please find page 207 of the 2012 APC annual report below. You can navigate through the pages in the report by either clicking on the pages listed below, or by using the keyword search tool below to find specific information within the annual report.-
 1
1 -
2
-
3
-
4
-
5
-
6
-
7
-
8
-
9
-
10
-
11
-
12
-
13
-
14
-
15
-
16
-
17
-
18
-
19
-
20
-
21
-
22
-
23
-
24
-
25
-
26
-
27
-
28
-
29
-
30
-
31
-
32
-
33
-
34
-
35
-
36
-
37
-
38
-
39
-
40
-
41
-
42
-
43
-
44
-
45
-
46
-
47
-
48
-
49
-
50
-
51
-
52
-
53
-
54
-
55
-
56
-
57
-
58
-
59
-
60
-
61
-
62
-
63
-
64
-
65
-
66
-
67
-
68
-
69
-
70
-
71
-
72
-
73
-
74
-
75
-
76
-
77
-
78
-
79
-
80
-
81
-
82
-
83
-
84
-
85
-
86
-
87
-
88
-
89
-
90
-
91
-
92
-
93
-
94
-
95
-
96
-
97
-
98
-
99
-
100
-
101
-
102
-
103
-
104
-
105
-
106
-
107
-
108
-
109
-
110
-
111
-
112
-
113
-
114
-
115
-
116
-
117
-
118
-
119
-
120
-
121
-
122
-
123
-
124
-
125
-
126
-
127
-
128
-
129
-
130
-
131
-
132
-
133
-
134
-
135
-
136
-
137
-
138
-
139
-
140
-
141
-
142
-
143
-
144
-
145
-
146
-
147
-
148
-
149
-
150
-
151
-
152
-
153
-
154
-
155
-
156
-
157
-
158
-
159
-
160
-
161
-
162
-
163
-
164
-
165
-
166
-
167
-
168
-
169
-
170
-
171
-
172
-
173
-
174
-
175
-
176
-
177
-
178
-
179
-
180
-
181
-
182
-
183
-
184
-
185
-
186
-
187
-
188
-
189
-
190
-
191
-
192
-
193
-
194
-
195
-
196
-
 197
197 -
 198
198 -
 199
199 -
 200
200 -
 201
201 -
 202
202 -
 203
203 -
 204
204 -
 205
205 -
 206
206 -
 207
207 -
 208
208 -
 209
209 -
 210
210 -
 211
211 -
 212
212 -
 213
213 -
 214
214 -
 215
215 -
 216
216 -
 217
217 -
218
-
219
-
220
-
221
-
222
-
223
-
224
-
225
-
226
-
227
-
228
-
229
-
230
-
231
-
232
-
233
-
234
-
235
-
236
-
237
-
238
-
239
-
240
-
241
-
242
-
243
-
244
-
245
-
246
-
247
-
248
-
249
-
250
-
251
-
252
-
253
-
254
-
255
-
256
-
257
-
258
-
259
-
260
-
261
-
262
-
263
-
264
-
265
-
266
-
267
-
268
-
269
-
270
-
271
-
272
-
273
-
274
-
275
-
276
-
277
-
278
-
279
-
280
-
281
-
282
-
283
-
284
-
285
-
286
-
287
-
288
-
289
-
290
-
291
-
292
-
293
-
294
-
295
-
296
-
297
-
298
-
299
-
300
-
301
-
302
-
303
-
304
-
305
-
306
-
307
-
308
-
309
-
310
-
311
-
312
-
313
-
314
-
315
-
316
-
317
-
318
-
319
-
320
 |
 |

2012 REGISTRATION DOCUMENT SCHNEIDER ELECTRIC 205
CONSOLIDATED FINANCIAL STATEMENTS AT DECEMBER31, 2012
5
NOTES TO THE CONSOLIDATED FINANCIAL STATEMENTS
Full year 2012 Full year 2011
Of which SE USA Of which SE USA
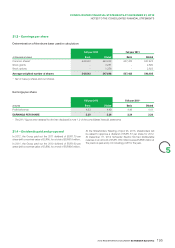
3. Change in projected benefi t obligation
Projected benefi t obligation at beginning of year 2,685 1,210 2,340 1,034
Service cost 48 3 41 2
Past service cost 1 - 1 4
Curtailments and settlements - - 4 -
Interest cost (effect of discounting) 116 55 110 53
Plan participants’ contributions 4 - 4 -
Benefi ts paid (119) (54) (100) (47)
Changes in the scope of consolidation 8 - (18) -
Actuarial (gains)/losses recognized in equity 340 157 222 120
Translation adjustments (17) (27) 62 44
Other (5) - 19 -
PROJECTED BENEFIT OBLIGATION
AT END OF YEAR 3,061 1,344 2,685 1,210
Actuarial gains and losses have been fully recognized in other
reserves.
They stem mainly from changes in actuarial assumptions (primarily
discount rates) used to measure obligations in the United States,
the United Kingdom and the euro zone.
At December 31, 2012, actuarial losses relative to the effects of
experience on pension and termination benefi t obligations totaled
EUR20million for the Group.
At December 31, 2011, actuarial losses relative to the effects
of experience totaled EUR20 million for the Group compared
to actuarial gains relative to the effects of experience totaled
EUR49million as at December31, 2010.
At December 31, 2009, actuarial gains relative to the effects
of experience totaled EUR64 million for the Group compared
to actuarial losses relative to the effects of experience totaled
EUR445million as at December31, 2008.
Full year 2012 Full year 2011
Of which SE USA Of which SE USA
4. Change in fair value of plan assets
Fair value of plan assets at beginning of year 1,421 814 1,304 735
Expected return on plan assets 91 60 86 56
Plan participants’ contribution 4 - 4 -
Employer contributions 103 9 83 66
Benefi ts paid (86) (54) (72) (47)
Actuarial gains/(losses) recognized in equity 49 41 (25) (23)
Changes in the scope of consolidation 2 - (8) -
Translation adjustments (7) (17) 42 27
Curtailments and settlements ----
Other (5) - 7 -
FAIR VALUE OF PLAN ASSETS AT END OF YEAR 1,572 853 1,421 814
The actual return on plan assets was EUR140million.
Actuarial gains and losses have been fully recognized in other reserves.
They stem mainly from the differential between the effective and expected return on plan assets in the US and Switzerland.