APC 2012 Annual Report Download - page 181
Download and view the complete annual report
Please find page 181 of the 2012 APC annual report below. You can navigate through the pages in the report by either clicking on the pages listed below, or by using the keyword search tool below to find specific information within the annual report.-
 1
1 -
2
-
3
-
4
-
5
-
6
-
7
-
8
-
9
-
10
-
11
-
12
-
13
-
14
-
15
-
16
-
17
-
18
-
19
-
20
-
21
-
22
-
23
-
24
-
25
-
26
-
27
-
28
-
29
-
30
-
31
-
32
-
33
-
34
-
35
-
36
-
37
-
38
-
39
-
40
-
41
-
42
-
43
-
44
-
45
-
46
-
47
-
48
-
49
-
50
-
51
-
52
-
53
-
54
-
55
-
56
-
57
-
58
-
59
-
60
-
61
-
62
-
63
-
64
-
65
-
66
-
67
-
68
-
69
-
70
-
71
-
72
-
73
-
74
-
75
-
76
-
77
-
78
-
79
-
80
-
81
-
82
-
83
-
84
-
85
-
86
-
87
-
88
-
89
-
90
-
91
-
92
-
93
-
94
-
95
-
96
-
97
-
98
-
99
-
100
-
101
-
102
-
103
-
104
-
105
-
106
-
107
-
108
-
109
-
110
-
111
-
112
-
113
-
114
-
115
-
116
-
117
-
118
-
119
-
120
-
121
-
122
-
123
-
124
-
125
-
126
-
127
-
128
-
129
-
130
-
131
-
132
-
133
-
134
-
135
-
136
-
137
-
138
-
139
-
140
-
141
-
142
-
143
-
144
-
145
-
146
-
147
-
148
-
149
-
150
-
151
-
152
-
153
-
154
-
155
-
156
-
157
-
158
-
159
-
160
-
161
-
162
-
163
-
164
-
165
-
166
-
167
-
168
-
169
-
170
-
 171
171 -
 172
172 -
 173
173 -
 174
174 -
 175
175 -
 176
176 -
 177
177 -
 178
178 -
 179
179 -
 180
180 -
 181
181 -
 182
182 -
 183
183 -
 184
184 -
 185
185 -
 186
186 -
 187
187 -
 188
188 -
 189
189 -
 190
190 -
 191
191 -
192
-
193
-
194
-
195
-
196
-
197
-
198
-
199
-
200
-
201
-
202
-
203
-
204
-
205
-
206
-
207
-
208
-
209
-
210
-
211
-
212
-
213
-
214
-
215
-
216
-
217
-
218
-
219
-
220
-
221
-
222
-
223
-
224
-
225
-
226
-
227
-
228
-
229
-
230
-
231
-
232
-
233
-
234
-
235
-
236
-
237
-
238
-
239
-
240
-
241
-
242
-
243
-
244
-
245
-
246
-
247
-
248
-
249
-
250
-
251
-
252
-
253
-
254
-
255
-
256
-
257
-
258
-
259
-
260
-
261
-
262
-
263
-
264
-
265
-
266
-
267
-
268
-
269
-
270
-
271
-
272
-
273
-
274
-
275
-
276
-
277
-
278
-
279
-
280
-
281
-
282
-
283
-
284
-
285
-
286
-
287
-
288
-
289
-
290
-
291
-
292
-
293
-
294
-
295
-
296
-
297
-
298
-
299
-
300
-
301
-
302
-
303
-
304
-
305
-
306
-
307
-
308
-
309
-
310
-
311
-
312
-
313
-
314
-
315
-
316
-
317
-
318
-
319
-
320
 |
 |

2012 REGISTRATION DOCUMENT SCHNEIDER ELECTRIC 179
CONSOLIDATED FINANCIAL STATEMENTS AT DECEMBER31, 2012
5
NOTES TO THE CONSOLIDATED FINANCIAL STATEMENTS
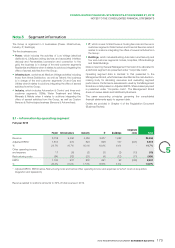
Note3
Segment information
The Group is organized in 5 businesses (Power, Infrastructure,
Industry, IT, Buildings).
The fi ve businesses are:
•Power, which includes the activities of Low Voltage (electrical
distribution), LifeSpace (wiring devices and associated interface
devices) and Renewables (conversion and connection to the
grid); the business is in charge of the end-customer segments
Residential and Marine when it relates to solutions integrating the
offers of several activities from the Group;
•Infrastructure, combines all Medium Voltage activities including
those from Areva Distribution, as well as Telvent; the business
is in charge of the end-customer segments Oil and Gas and
Utilities when it relates to solutions integrating the offers of several
activities from the Group;
•Industry, which includes Automation&Control and three end-
customer segments: OEMs, Water Treatment and Mining,
Minerals & Metals when it relates to solutions integrating the
offers of several activities from the Group, as well as Custom
Sensors&Technologies business (Sensors&Automotives);
•IT, which covers Critical Power&Cooling Services and two end-
customer segments: Data Centers and Financial Services when it
relates to solutions integrating the offers of several activities from
the Group;
•Buildings, which includes Building Automation and Security and
four end-customer segments: Hotels, Hospitals, Offi ce Buildings
and Retail Buildings.
Data concerning General Management that cannot be allocated to
a particular segment are presented under “Corporate costs”.
Operating segment data is identical to that presented to the
Management Board, which has been identifi ed as the main decision-
making body for allocating resources and evaluating segment
performance. Performance assessments used by the Management
Board are notably based on Adjusted EBITA. Share-based payment
is presented under “Corporate costs”. The Management Board
does not review assets and liabilities by Business.
The same accounting principles governing the consolidated
fi nancial statements apply to segment data.
Details are provided in Chapter 4 of the Registration Document
(Business Review).
3.1 – Information by operating segment
Full year 2012
Power Infrastructure Industry IT Buildings Corporate
costs Total
Revenue 8,738 5,366 4,483 3,677 1,682 - 23,946
Adjusted EBITA* 1,813 575 823 698 107 (501) 3,515
%20.7% 10.7% 18.4% 19.0% 6.4% -
14.7%
Other operating income
andexpense 17 (6) (2) (3) (3) (13) (10)
Restructuring costs (84) (32) (21) (4) (12) (11) (164)
EBITA 1,746 537 800 691 92 (525) 3,341
% 20.0% 10.0% 17.8% 18.8% 5.5% - 14.0%
* Adjusted EBITA: EBITA before Restructuring costs and before Other operating income and expenses (of which Costs of acquisition,
integration and separation).
Revenue related to solutions amounts to 39% of total revenue in2012.