APC 2012 Annual Report Download - page 64
Download and view the complete annual report
Please find page 64 of the 2012 APC annual report below. You can navigate through the pages in the report by either clicking on the pages listed below, or by using the keyword search tool below to find specific information within the annual report.-
 1
1 -
2
-
3
-
4
-
5
-
6
-
7
-
8
-
9
-
10
-
11
-
12
-
13
-
14
-
15
-
16
-
17
-
18
-
19
-
20
-
21
-
22
-
23
-
24
-
25
-
26
-
27
-
28
-
29
-
30
-
31
-
32
-
33
-
34
-
35
-
36
-
37
-
38
-
39
-
40
-
41
-
42
-
43
-
44
-
45
-
46
-
47
-
48
-
49
-
50
-
51
-
52
-
53
-
 54
54 -
 55
55 -
 56
56 -
 57
57 -
 58
58 -
 59
59 -
 60
60 -
 61
61 -
 62
62 -
 63
63 -
 64
64 -
 65
65 -
 66
66 -
 67
67 -
 68
68 -
 69
69 -
 70
70 -
 71
71 -
 72
72 -
 73
73 -
 74
74 -
75
-
76
-
77
-
78
-
79
-
80
-
81
-
82
-
83
-
84
-
85
-
86
-
87
-
88
-
89
-
90
-
91
-
92
-
93
-
94
-
95
-
96
-
97
-
98
-
99
-
100
-
101
-
102
-
103
-
104
-
105
-
106
-
107
-
108
-
109
-
110
-
111
-
112
-
113
-
114
-
115
-
116
-
117
-
118
-
119
-
120
-
121
-
122
-
123
-
124
-
125
-
126
-
127
-
128
-
129
-
130
-
131
-
132
-
133
-
134
-
135
-
136
-
137
-
138
-
139
-
140
-
141
-
142
-
143
-
144
-
145
-
146
-
147
-
148
-
149
-
150
-
151
-
152
-
153
-
154
-
155
-
156
-
157
-
158
-
159
-
160
-
161
-
162
-
163
-
164
-
165
-
166
-
167
-
168
-
169
-
170
-
171
-
172
-
173
-
174
-
175
-
176
-
177
-
178
-
179
-
180
-
181
-
182
-
183
-
184
-
185
-
186
-
187
-
188
-
189
-
190
-
191
-
192
-
193
-
194
-
195
-
196
-
197
-
198
-
199
-
200
-
201
-
202
-
203
-
204
-
205
-
206
-
207
-
208
-
209
-
210
-
211
-
212
-
213
-
214
-
215
-
216
-
217
-
218
-
219
-
220
-
221
-
222
-
223
-
224
-
225
-
226
-
227
-
228
-
229
-
230
-
231
-
232
-
233
-
234
-
235
-
236
-
237
-
238
-
239
-
240
-
241
-
242
-
243
-
244
-
245
-
246
-
247
-
248
-
249
-
250
-
251
-
252
-
253
-
254
-
255
-
256
-
257
-
258
-
259
-
260
-
261
-
262
-
263
-
264
-
265
-
266
-
267
-
268
-
269
-
270
-
271
-
272
-
273
-
274
-
275
-
276
-
277
-
278
-
279
-
280
-
281
-
282
-
283
-
284
-
285
-
286
-
287
-
288
-
289
-
290
-
291
-
292
-
293
-
294
-
295
-
296
-
297
-
298
-
299
-
300
-
301
-
302
-
303
-
304
-
305
-
306
-
307
-
308
-
309
-
310
-
311
-
312
-
313
-
314
-
315
-
316
-
317
-
318
-
319
-
320
 |
 |

2012 REGISTRATION DOCUMENT SCHNEIDER ELECTRIC62
SUSTAINABLE DEVELOPMENT
2SCHNEIDER ELECTRIC’S COMMITMENT TO ENVIRONMENTAL PERFORMANCE
two distinct indicators - reduction of CO2 emissions in transport
and reduction of energy consumption; the Green Premium
indicator target was raised from 2/3 to 75%.
•Two indicators had a very strong start in2012: reduction of CO2
emissions in transport with 14.8% reduction, and reduction of
energy consumption with 6.1% reduction; this was the result of
efforts undertaken over the past several years in these areas.
3.2 Reduction of CO2 Emissions
Approach
Schneider Electric is not subject to European quotas on carbon
emissions since it is an industrial business that globally produces
few emissions in comparison to energy intensive industries.
Schneider Electric is therefore classifi ed in the low emissions sector
by the Carbon Disclosure Project (1). However, the Group has
defi ned measures to reduce its carbon emissions.
With the support of the Carbon 4 consultancy fi rm, in2011-2012
Schneider Electric updated the carbon footprint performed in2007
(from2006 data), from its upstream suppliers to its downstream
distribution chain. The main sources of emissions remain the same:
purchase of raw materials (steel, plastic and metal) and equipment
represents around 70% of the total. The logistics involving upstream
and downstream supply from and to suppliers and fi rst tier
customers represents 15%, of which the main part comes from road
freight. Schneider Electric is aiming to reduce emissions related to
transport paid by the Group by 10% over the next three years (see
p. 65 ). Direct emissions (scope1 and2) in Group buildings represent
around 9%. Schneider Electric is committed to reducing its energy
emissions by 10% over the 2012-2014 period (see p. 63-64 ). More
modest items –employees’ travels and waste– represent 5% and
1% respectively.
This emissions split is representative of a second transformation
activity.
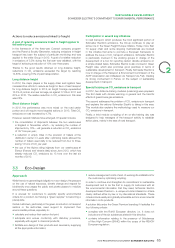
Compared to emissions evaluated in2006, carbon intensity of the
Group fell and certain sources were the subject of specifi c work in
which the results are very visible: SF6 emissions for example were
signifi cantly reduced.
Finally, the structure of emissions has changed: freight emissions as
a percentage have decreased following a correction of the method
used for2006 fi gures.
9%
Site energy consumption
(and SF6)
15%
Logistics transportation
(from upstream
to customer delivery)
1%
Others
(including waste)
5%
Employee travel
(daily commute
and business trips)
70%
Purchases of raw
material and equipment
For the 2009-2011 period, Schneider Electric set itself the following
objectives:
•reduce CO2 equivalent emissions of 30,000tons per year for all
scopes1 and2 as defi ned in the GHG Protocol(2) (emissions of
SF6 gas in the industrial sites concerned, and energy consumption
of the industrial and logistics sites and some tertiary sites) as well
as a part of scope 3 as defi ned in the GHG Protocol (air cargo in
the long distance freight transport mix(3)); the objective was to
reduce CO2 emissions by approximately 15% over three years on
a constant basis compared to2008;
•implement a recovery process for SF6 gas in 10 countries.
The fi rst devices containing SF6 gas sold by Schneider Electric
reached their end-of-life at the start of2000. The objective was
to develop commercial offers that allow customers to dispose of
their end-of-life, SF6 containing devices, in order to completely
extract the gas and recycle it.
(1) Source: Carbon Disclosure Project 2008, Survey of the SBF120 French companies.
(2) The Greenhouse Gas Protocol (GHG Protocol) is the most widely-used international accounting tool for CO2-equivalent emissions. Scope1
corresponds to greenhouse gas emissions from sources held or controlled by the Company. Scope2 corresponds to emissions for the
generation of electricity consumed by the Company. Scope3 corresponds to all other indirect emissions of the Company from sources that it
does not hold or control (transport, use of products and services, etc.).
(3) Long-distance freight includes air freight and maritime freight.