APC 2012 Annual Report Download - page 65
Download and view the complete annual report
Please find page 65 of the 2012 APC annual report below. You can navigate through the pages in the report by either clicking on the pages listed below, or by using the keyword search tool below to find specific information within the annual report.-
 1
1 -
2
-
3
-
4
-
5
-
6
-
7
-
8
-
9
-
10
-
11
-
12
-
13
-
14
-
15
-
16
-
17
-
18
-
19
-
20
-
21
-
22
-
23
-
24
-
25
-
26
-
27
-
28
-
29
-
30
-
31
-
32
-
33
-
34
-
35
-
36
-
37
-
38
-
39
-
40
-
41
-
42
-
43
-
44
-
45
-
46
-
47
-
48
-
49
-
50
-
51
-
52
-
53
-
54
-
 55
55 -
 56
56 -
 57
57 -
 58
58 -
 59
59 -
 60
60 -
 61
61 -
 62
62 -
 63
63 -
 64
64 -
 65
65 -
 66
66 -
 67
67 -
 68
68 -
 69
69 -
 70
70 -
 71
71 -
 72
72 -
 73
73 -
 74
74 -
 75
75 -
76
-
77
-
78
-
79
-
80
-
81
-
82
-
83
-
84
-
85
-
86
-
87
-
88
-
89
-
90
-
91
-
92
-
93
-
94
-
95
-
96
-
97
-
98
-
99
-
100
-
101
-
102
-
103
-
104
-
105
-
106
-
107
-
108
-
109
-
110
-
111
-
112
-
113
-
114
-
115
-
116
-
117
-
118
-
119
-
120
-
121
-
122
-
123
-
124
-
125
-
126
-
127
-
128
-
129
-
130
-
131
-
132
-
133
-
134
-
135
-
136
-
137
-
138
-
139
-
140
-
141
-
142
-
143
-
144
-
145
-
146
-
147
-
148
-
149
-
150
-
151
-
152
-
153
-
154
-
155
-
156
-
157
-
158
-
159
-
160
-
161
-
162
-
163
-
164
-
165
-
166
-
167
-
168
-
169
-
170
-
171
-
172
-
173
-
174
-
175
-
176
-
177
-
178
-
179
-
180
-
181
-
182
-
183
-
184
-
185
-
186
-
187
-
188
-
189
-
190
-
191
-
192
-
193
-
194
-
195
-
196
-
197
-
198
-
199
-
200
-
201
-
202
-
203
-
204
-
205
-
206
-
207
-
208
-
209
-
210
-
211
-
212
-
213
-
214
-
215
-
216
-
217
-
218
-
219
-
220
-
221
-
222
-
223
-
224
-
225
-
226
-
227
-
228
-
229
-
230
-
231
-
232
-
233
-
234
-
235
-
236
-
237
-
238
-
239
-
240
-
241
-
242
-
243
-
244
-
245
-
246
-
247
-
248
-
249
-
250
-
251
-
252
-
253
-
254
-
255
-
256
-
257
-
258
-
259
-
260
-
261
-
262
-
263
-
264
-
265
-
266
-
267
-
268
-
269
-
270
-
271
-
272
-
273
-
274
-
275
-
276
-
277
-
278
-
279
-
280
-
281
-
282
-
283
-
284
-
285
-
286
-
287
-
288
-
289
-
290
-
291
-
292
-
293
-
294
-
295
-
296
-
297
-
298
-
299
-
300
-
301
-
302
-
303
-
304
-
305
-
306
-
307
-
308
-
309
-
310
-
311
-
312
-
313
-
314
-
315
-
316
-
317
-
318
-
319
-
320
 |
 |

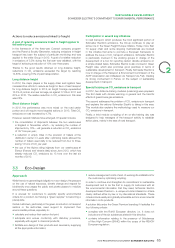
2012 REGISTRATION DOCUMENT SCHNEIDER ELECTRIC 63
SUSTAINABLE DEVELOPMENT
2
SCHNEIDER ELECTRIC’S COMMITMENT TO ENVIRONMENTAL PERFORMANCE
At the end of the One program (2009-2011), Schneider Electric
had saved nearly 162,000tons of CO2 equivalent. The reduction
target of 30,000tons per year (i.e., 90,000tons over the three-year
period of the program) was exceeded. In addition, eight countries
had established an SF6 gas recovery pathway.
The following actions were undertaken to achieve the target:
•the carbon footprint of scopes1 and2, as defi ned in the GHG
Protocol, is calculated monthly, as is the performance of each
site concerned;
•since 2010, the carbon performance has been presented
monthly to the Management Committee of the Global Supply
Chain Management by the Group’s Environmental Director and
the three SERE Directors (Safety, Environment and Real Estate);
•since2010, the carbon footprint reduction target has been taken
into account for the performance incentives of all Global Supply
Chain Management personnel who receive a bonus;
•since2011, the reduction of the carbon footprint and the energy
effi ciency programs were included in the performance incentives
of the Executive Committee member in charge of Global
Supply Chain.
In 2011, Schneider Electric worked on defi ning its new carbon
emission reduction targets for the 2012-2014 period within the
scope of the company program. The Group’s approach is based
on measuring, controlling and reducing CO2 emissions, starting
with the most direct ones upon which the Group has most impact
and greater reliability in terms of metering (these correspond to
scopes 1 and 2 defi ned in the GHG Protocol) followed by more
indirect emissions (corresponding to scope3 of the GHG Protocol).
Consequently, for the 2012-2014 period, Schneider Electric:
•set an objective to limit leaks of SF6 to 0.95% of the consumption
of that gas on those sites. As a reminder, over the 2009-2011
period, the Group reduced this rate from 4% to 0.95% (the goal
was to reach 1%);
•included on the Planet & Society Barometer the objective of
achieving 10% savings on its energy consumption;
•expanded its ambition on measuring and reducing its scope3
by integrating into the Planet & Society Barometer a specifi c
objective of a 10% reduction in CO2 in transportation paid by
the Group.
Action plans
Actions to reduce SF6 emissions
The CO2 savings realized by Schneider Electric over the 2009-
2011 period was mainly due to the reduction of SF6 leaks in the
production processes, resulting from:
•mandatory monthly reporting since2010 rather than twice yearly
in2009;
•a Failure Modes, Effects and Criticality Analysis (FMECA) deployed
for manufacturing processes that involve SF6 gas since2010;
•improvements in processes and measurement on certain high
emission sites, particularly the SCFME Libourne site (France), the
largest European site, and the SBLMV Peking site (China), the
Asian site with the highest SF6 consumption.
Industrial leakage of SF6 gas had to be reduced from a rate of 4%
at the end of2008 to a rate of 0.95% by the end of2011 for gas
consumed during production. The investments made to achieve
this performance continue to bear fruit and the Group has set
the objective of maintaining this rate at a maximum of 0.95% of
SF6 leakage. Since this objective is no longer a goal of company
change, it is no longer included in the Planet&Society Barometer
over the 2012-2014 period, but continues to be followed in the
dashboard of the Group’s internal control.
In 2012, the Group exceeded its objective with an SF6 leakage
rate of 0.75%, equivalent to about 10,4 00tons of CO2 emissions
avoided compared to2011 (data corrected for production level).
Energy savings
In general, Schneider Electric sites are low consumers of energy,
compared with more energy intensive industries. However,
Schneider Electric wishes to set an example in the reduction of
energy consumption by applying its own solutions.
Energy Action program
Approach
Schneider Energy Action is a program for the continual reduction in
energy consumption in all of the Group’s sites. The objectives are:
•cutting out waste of electricity, natural gas and oil, and thereby
reducing costs;
•deploying Schneider Electric’s energy effi ciency solutions at its
own sites;
•demonstrating Schneider Electric’s expertise to its customers;
•raising employees’ awareness about new energy effi ciency
solutions and their own contribution to product development.
Around 9% of total Group emissions come from energy
consumption at its sites (according to the carbon footprint of2012).
Since 2005, Schneider Electric has fi xed annual objectives for
reduction and publishes (internally) the energy consumption of
each of its production and logistics sites each year, as part of the
Schneider Energy Action program. The Group met and in some
cases exceeded its objective of reducing energy consumption per
production site employee by 10% between 2005 and 2008. The
2009-2011 objective of -4% per year and per employee was also
achieved overall at the end of2011.
The Planet&Society Barometer for the One program (2009-2011)
extended the monitoring of energy consumption to major tertiary
sites, including these in the objectives for ISO14001 certifi cation
of sites. The Group’s head offi ce in France was therefore certifi ed
according to the ISO14001 environmental management standard,
the EN 16001 energy management standard in2010 and was the
fi rst building to receive the new ISO50001 certifi cation in 2011.
The sites’ energy consumption is monitored on a monthly basis
by the Management Board of Global Supply Chain Management
since2010. Global Supply Chain Management is responsible for all
of the Group’s sites.