APC 2012 Annual Report Download - page 11
Download and view the complete annual report
Please find page 11 of the 2012 APC annual report below. You can navigate through the pages in the report by either clicking on the pages listed below, or by using the keyword search tool below to find specific information within the annual report.-
 1
1 -
 2
2 -
 3
3 -
 4
4 -
 5
5 -
 6
6 -
 7
7 -
 8
8 -
 9
9 -
 10
10 -
 11
11 -
 12
12 -
 13
13 -
 14
14 -
 15
15 -
 16
16 -
 17
17 -
 18
18 -
 19
19 -
 20
20 -
 21
21 -
 22
22 -
23
-
24
-
25
-
26
-
27
-
28
-
29
-
30
-
31
-
32
-
33
-
34
-
35
-
36
-
37
-
38
-
39
-
40
-
41
-
42
-
43
-
44
-
45
-
46
-
47
-
48
-
49
-
50
-
51
-
52
-
53
-
54
-
55
-
56
-
57
-
58
-
59
-
60
-
61
-
62
-
63
-
64
-
65
-
66
-
67
-
68
-
69
-
70
-
71
-
72
-
73
-
74
-
75
-
76
-
77
-
78
-
79
-
80
-
81
-
82
-
83
-
84
-
85
-
86
-
87
-
88
-
89
-
90
-
91
-
92
-
93
-
94
-
95
-
96
-
97
-
98
-
99
-
100
-
101
-
102
-
103
-
104
-
105
-
106
-
107
-
108
-
109
-
110
-
111
-
112
-
113
-
114
-
115
-
116
-
117
-
118
-
119
-
120
-
121
-
122
-
123
-
124
-
125
-
126
-
127
-
128
-
129
-
130
-
131
-
132
-
133
-
134
-
135
-
136
-
137
-
138
-
139
-
140
-
141
-
142
-
143
-
144
-
145
-
146
-
147
-
148
-
149
-
150
-
151
-
152
-
153
-
154
-
155
-
156
-
157
-
158
-
159
-
160
-
161
-
162
-
163
-
164
-
165
-
166
-
167
-
168
-
169
-
170
-
171
-
172
-
173
-
174
-
175
-
176
-
177
-
178
-
179
-
180
-
181
-
182
-
183
-
184
-
185
-
186
-
187
-
188
-
189
-
190
-
191
-
192
-
193
-
194
-
195
-
196
-
197
-
198
-
199
-
200
-
201
-
202
-
203
-
204
-
205
-
206
-
207
-
208
-
209
-
210
-
211
-
212
-
213
-
214
-
215
-
216
-
217
-
218
-
219
-
220
-
221
-
222
-
223
-
224
-
225
-
226
-
227
-
228
-
229
-
230
-
231
-
232
-
233
-
234
-
235
-
236
-
237
-
238
-
239
-
240
-
241
-
242
-
243
-
244
-
245
-
246
-
247
-
248
-
249
-
250
-
251
-
252
-
253
-
254
-
255
-
256
-
257
-
258
-
259
-
260
-
261
-
262
-
263
-
264
-
265
-
266
-
267
-
268
-
269
-
270
-
271
-
272
-
273
-
274
-
275
-
276
-
277
-
278
-
279
-
280
-
281
-
282
-
283
-
284
-
285
-
286
-
287
-
288
-
289
-
290
-
291
-
292
-
293
-
294
-
295
-
296
-
297
-
298
-
299
-
300
-
301
-
302
-
303
-
304
-
305
-
306
-
307
-
308
-
309
-
310
-
311
-
312
-
313
-
314
-
315
-
316
-
317
-
318
-
319
-
320
 |
 |

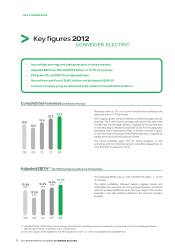
2012 REGISTRATION DOCUMENT SCHNEIDER ELECTRIC 9
KEY FIGURES 2012
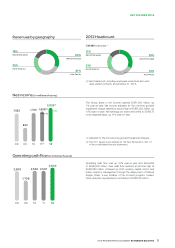
Revenues by geography
18%
Rest of the world
25%
North America
30%
Western Europe
27%
Asia-Pacific
Net income (in millions of euros)
11(2)
1,808(1)
12
2,023(1)
08
1,682
09
824
10
1,720
1,840
1,793
The Group share in net income reached EUR1,840 million, up
1% year-on-year. Net income adjusted for the one-time goodwill
impairment charge reached a record high at EUR2,023million, up
12% year-on-year. Net earnings per share amounted to EUR3.73
on an adjusted basis, up 11% year-on-year.
(1) Adjusted for the non-recurring goodwill impairment charges.
(2) The 2011 fi gures were restated for the item disclosed in note 1.2
of the consolidated fi nancial statements.
Operating cash flow (in millions of euros)
1108 09 10
2,500
1,708
2,534 2,537
12
2,802 Operating cash fl ow was up 10% year-on-year and amounted
to EUR2,802 million. Free cash fl ow reached an all time high at
EUR2,082 million, achieved by strict working capital control and
better inventory management through the deployment of Tailored
Supply Chain, a key initiative of the Connect program. Indeed,
stock reduction represented a contribution of EUR210 million.
2012 Headcount
139,989 employees (1)
15%
Rest of the world
21%
North America
33%
Western Europe
31%
Asia-Pacific
(1) Spot headcount, including employees under fi xed-term and
open-ended contracts, at December 31, 2012.