APC 2012 Annual Report Download - page 196
Download and view the complete annual report
Please find page 196 of the 2012 APC annual report below. You can navigate through the pages in the report by either clicking on the pages listed below, or by using the keyword search tool below to find specific information within the annual report.-
 1
1 -
2
-
3
-
4
-
5
-
6
-
7
-
8
-
9
-
10
-
11
-
12
-
13
-
14
-
15
-
16
-
17
-
18
-
19
-
20
-
21
-
22
-
23
-
24
-
25
-
26
-
27
-
28
-
29
-
30
-
31
-
32
-
33
-
34
-
35
-
36
-
37
-
38
-
39
-
40
-
41
-
42
-
43
-
44
-
45
-
46
-
47
-
48
-
49
-
50
-
51
-
52
-
53
-
54
-
55
-
56
-
57
-
58
-
59
-
60
-
61
-
62
-
63
-
64
-
65
-
66
-
67
-
68
-
69
-
70
-
71
-
72
-
73
-
74
-
75
-
76
-
77
-
78
-
79
-
80
-
81
-
82
-
83
-
84
-
85
-
86
-
87
-
88
-
89
-
90
-
91
-
92
-
93
-
94
-
95
-
96
-
97
-
98
-
99
-
100
-
101
-
102
-
103
-
104
-
105
-
106
-
107
-
108
-
109
-
110
-
111
-
112
-
113
-
114
-
115
-
116
-
117
-
118
-
119
-
120
-
121
-
122
-
123
-
124
-
125
-
126
-
127
-
128
-
129
-
130
-
131
-
132
-
133
-
134
-
135
-
136
-
137
-
138
-
139
-
140
-
141
-
142
-
143
-
144
-
145
-
146
-
147
-
148
-
149
-
150
-
151
-
152
-
153
-
154
-
155
-
156
-
157
-
158
-
159
-
160
-
161
-
162
-
163
-
164
-
165
-
166
-
167
-
168
-
169
-
170
-
171
-
172
-
173
-
174
-
175
-
176
-
177
-
178
-
179
-
180
-
181
-
182
-
183
-
184
-
185
-
 186
186 -
 187
187 -
 188
188 -
 189
189 -
 190
190 -
 191
191 -
 192
192 -
 193
193 -
 194
194 -
 195
195 -
 196
196 -
 197
197 -
 198
198 -
 199
199 -
 200
200 -
 201
201 -
 202
202 -
 203
203 -
 204
204 -
 205
205 -
 206
206 -
207
-
208
-
209
-
210
-
211
-
212
-
213
-
214
-
215
-
216
-
217
-
218
-
219
-
220
-
221
-
222
-
223
-
224
-
225
-
226
-
227
-
228
-
229
-
230
-
231
-
232
-
233
-
234
-
235
-
236
-
237
-
238
-
239
-
240
-
241
-
242
-
243
-
244
-
245
-
246
-
247
-
248
-
249
-
250
-
251
-
252
-
253
-
254
-
255
-
256
-
257
-
258
-
259
-
260
-
261
-
262
-
263
-
264
-
265
-
266
-
267
-
268
-
269
-
270
-
271
-
272
-
273
-
274
-
275
-
276
-
277
-
278
-
279
-
280
-
281
-
282
-
283
-
284
-
285
-
286
-
287
-
288
-
289
-
290
-
291
-
292
-
293
-
294
-
295
-
296
-
297
-
298
-
299
-
300
-
301
-
302
-
303
-
304
-
305
-
306
-
307
-
308
-
309
-
310
-
311
-
312
-
313
-
314
-
315
-
316
-
317
-
318
-
319
-
320
 |
 |

2012 REGISTRATION DOCUMENT SCHNEIDER ELECTRIC194
CONSOLIDATED FINANCIAL STATEMENTS AT DECEMBER31, 2012
5NOTES TO THE CONSOLIDATED FINANCIAL STATEMENTS
Note21
Equity
21.1 – Capital
Share capital
At the Annual General Meeting held on April21, 2011 Schneider
Electric shareholders approved the division of the nominal value of
the shares by two. The operation took effect on September2, 2011
and resulted in the issuance of 271,959,091new shares.
The Company’s share capital at December31, 2012 amounted to
EUR2,221,668,056, represented by 555,417,014shares with a par
value of EUR4, all fully paid up.
At December31, 2012, a total of 555,417,014voting rights were
attached to the 600,506,571shares outstanding.
Schneider Electric’s capital management strategy is designed to:
•ensure Group liquidity;
•optimize its fi nancial structure;
•optimize the weighted average cost of capital.
The strategy must also ensure the Group has access to different
capital markets under the best possible conditions. Factors taken
into account for decision-making purposes include objectives
expressed in terms of earnings per share, ratings or balance sheet
stability. Finally, decisions may be implemented depending on
specifi c market conditions.
Changes in share capital
Changes in share capital since December31, 2010 were as follows:
Cumulative number of shares Total (in euros)
Capital at Dec.31, 2010 271,959,091 2,175,672,728
Division of the par value by two 271,959,091 -
Exercise of stock options 1,169,210 4,676,840
Employee share issue 3,855,632 15,422,528
Capital at Dec.31, 2011 548,943,024 2,195,772,096
Exercise of stock options 2,952,154 11,808,616
Employee share issue 3,521,836 14,087,344
CAPITAL AT DEC.31, 2012 555,417,014 2,221,668,056
The share premium account increased by EUR195,532,623following the exercise of options and the increases in capital.
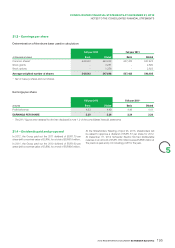
21.2 – Ownership structure
Dec.31, 2012 Dec.31, 2011
Capital
%Number of
shares Voting rights
%Number of
votingrights Capital
%Voting rights
%
Capital Research and Management
Company(1) 7.5 41,643,226 6.9 41,643,226 9.4 8.9
CDC 3.7 20,349,002 6.5 38,803,092 3.7 4.6
Employees 4.4 24,652,612 6.8 40,660,345 4.6 7.1
Own shares (2) 0.0 1,058 - - 0.0 -
Treasury shares 1.5 8,580,080 - - 1.7 -
Public 82.9 460,191,036 78.4 470,818,770 80.6 78.0
TOTAL 100.0 555,417,014 100.0 600,506,571 100.0 100.0
(1) To the best of the Company’s knowledge.
(2) Number of voting rights as defi ned in article223-11 of the AMF general regulations, which includes shares stripped of voting rights.
No shareholders’ pact was in effect as of December31, 2012.