APC 2012 Annual Report Download - page 182
Download and view the complete annual report
Please find page 182 of the 2012 APC annual report below. You can navigate through the pages in the report by either clicking on the pages listed below, or by using the keyword search tool below to find specific information within the annual report.-
 1
1 -
2
-
3
-
4
-
5
-
6
-
7
-
8
-
9
-
10
-
11
-
12
-
13
-
14
-
15
-
16
-
17
-
18
-
19
-
20
-
21
-
22
-
23
-
24
-
25
-
26
-
27
-
28
-
29
-
30
-
31
-
32
-
33
-
34
-
35
-
36
-
37
-
38
-
39
-
40
-
41
-
42
-
43
-
44
-
45
-
46
-
47
-
48
-
49
-
50
-
51
-
52
-
53
-
54
-
55
-
56
-
57
-
58
-
59
-
60
-
61
-
62
-
63
-
64
-
65
-
66
-
67
-
68
-
69
-
70
-
71
-
72
-
73
-
74
-
75
-
76
-
77
-
78
-
79
-
80
-
81
-
82
-
83
-
84
-
85
-
86
-
87
-
88
-
89
-
90
-
91
-
92
-
93
-
94
-
95
-
96
-
97
-
98
-
99
-
100
-
101
-
102
-
103
-
104
-
105
-
106
-
107
-
108
-
109
-
110
-
111
-
112
-
113
-
114
-
115
-
116
-
117
-
118
-
119
-
120
-
121
-
122
-
123
-
124
-
125
-
126
-
127
-
128
-
129
-
130
-
131
-
132
-
133
-
134
-
135
-
136
-
137
-
138
-
139
-
140
-
141
-
142
-
143
-
144
-
145
-
146
-
147
-
148
-
149
-
150
-
151
-
152
-
153
-
154
-
155
-
156
-
157
-
158
-
159
-
160
-
161
-
162
-
163
-
164
-
165
-
166
-
167
-
168
-
169
-
170
-
171
-
 172
172 -
 173
173 -
 174
174 -
 175
175 -
 176
176 -
 177
177 -
 178
178 -
 179
179 -
 180
180 -
 181
181 -
 182
182 -
 183
183 -
 184
184 -
 185
185 -
 186
186 -
 187
187 -
 188
188 -
 189
189 -
 190
190 -
 191
191 -
 192
192 -
193
-
194
-
195
-
196
-
197
-
198
-
199
-
200
-
201
-
202
-
203
-
204
-
205
-
206
-
207
-
208
-
209
-
210
-
211
-
212
-
213
-
214
-
215
-
216
-
217
-
218
-
219
-
220
-
221
-
222
-
223
-
224
-
225
-
226
-
227
-
228
-
229
-
230
-
231
-
232
-
233
-
234
-
235
-
236
-
237
-
238
-
239
-
240
-
241
-
242
-
243
-
244
-
245
-
246
-
247
-
248
-
249
-
250
-
251
-
252
-
253
-
254
-
255
-
256
-
257
-
258
-
259
-
260
-
261
-
262
-
263
-
264
-
265
-
266
-
267
-
268
-
269
-
270
-
271
-
272
-
273
-
274
-
275
-
276
-
277
-
278
-
279
-
280
-
281
-
282
-
283
-
284
-
285
-
286
-
287
-
288
-
289
-
290
-
291
-
292
-
293
-
294
-
295
-
296
-
297
-
298
-
299
-
300
-
301
-
302
-
303
-
304
-
305
-
306
-
307
-
308
-
309
-
310
-
311
-
312
-
313
-
314
-
315
-
316
-
317
-
318
-
319
-
320
 |
 |

2012 REGISTRATION DOCUMENT SCHNEIDER ELECTRIC180
CONSOLIDATED FINANCIAL STATEMENTS AT DECEMBER31, 2012
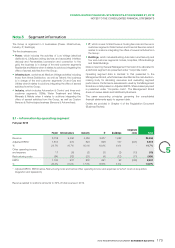
5NOTES TO THE CONSOLIDATED FINANCIAL STATEMENTS
Full year 2011*
Power Infrastructure Industry IT Buildings Corporate
costs Total
Revenue 8,262 4,897 4,397 3,237 1,552 - 22,345
Adjusted EBITA** 1,705 511 774 523 145 (468) 3,190
% 20.6% 10.4% 17.6% 16.2% 9.3% - 14.3%
Other operating income and
expense 49 (27) 4 (17) (8) (9) (8)
Restructuring costs (75) (19) (24) (9) (11) (7) (145)
EBITA 1,679 465 754 497 126 (484) 3,037
% 20.3% 9.5% 17.1% 15.4% 8.1% - 13.6%
* The 2011 fi gures were restated for the item disclosed in note1.2 of the consolidated fi nancial statements, thus EUR42million for the
Group out of which EUR35million for Power and EUR7million for Industry as a reduction of revenues, EBITA and Adjusted EBITA.
** Adjusted EBITA: EBITA before Restructuring costs and before Other operating income and expenses (of which Costs of acquisition,
integration and separation).
3.2 – Information by region
The geographic regions covered by the Group are:
•Western Europe;
•North America: United States, Canada and Mexico;
•Asia-Pacifi c;
•Rest of the World (Eastern Europe, Middle East, Africa, South America).
Non-current assets include net goodwill, net intangible assets and net property, plant and equipment.
Dec.31, 2012
Western
Europe of which
France North
America of which
USA Asia-
Pacifi c of which
China Rest of the
world Total
Revenue by country market 7,073 1,822 5,949 4,966 6,507 3,036 4,417 23,946
Non-current assets 8,194 1,801 6,591 6,404 4,389 1,205 871 20,045
Dec.31, 2011*
Western
Europe of which
France North
America of which
USA Asia-
Pacifi c of which
China Rest of the
world Total
Revenue by country market 7,142 1,916 5,208 4,360 5,933 2,798 4,062 22,345
Non-current assets 7,361 1,710 7,466 7,310 4,413 1,095 811 20,051
Moreover, the Group follows the share of new economies in revenue:
Full year 2012 Full year 2011
Revenue – Mature countries 14,186 59% 13,512 60%
Revenue – New economies 9,760 41% 8,833 40%
TOTAL 23,946 100% 22,345 100%
* The 2011 fi gures were restated for the item disclosed in note 1.2 of the consolidated fi nancial statements.