APC 2012 Annual Report Download - page 195
Download and view the complete annual report
Please find page 195 of the 2012 APC annual report below. You can navigate through the pages in the report by either clicking on the pages listed below, or by using the keyword search tool below to find specific information within the annual report.-
 1
1 -
2
-
3
-
4
-
5
-
6
-
7
-
8
-
9
-
10
-
11
-
12
-
13
-
14
-
15
-
16
-
17
-
18
-
19
-
20
-
21
-
22
-
23
-
24
-
25
-
26
-
27
-
28
-
29
-
30
-
31
-
32
-
33
-
34
-
35
-
36
-
37
-
38
-
39
-
40
-
41
-
42
-
43
-
44
-
45
-
46
-
47
-
48
-
49
-
50
-
51
-
52
-
53
-
54
-
55
-
56
-
57
-
58
-
59
-
60
-
61
-
62
-
63
-
64
-
65
-
66
-
67
-
68
-
69
-
70
-
71
-
72
-
73
-
74
-
75
-
76
-
77
-
78
-
79
-
80
-
81
-
82
-
83
-
84
-
85
-
86
-
87
-
88
-
89
-
90
-
91
-
92
-
93
-
94
-
95
-
96
-
97
-
98
-
99
-
100
-
101
-
102
-
103
-
104
-
105
-
106
-
107
-
108
-
109
-
110
-
111
-
112
-
113
-
114
-
115
-
116
-
117
-
118
-
119
-
120
-
121
-
122
-
123
-
124
-
125
-
126
-
127
-
128
-
129
-
130
-
131
-
132
-
133
-
134
-
135
-
136
-
137
-
138
-
139
-
140
-
141
-
142
-
143
-
144
-
145
-
146
-
147
-
148
-
149
-
150
-
151
-
152
-
153
-
154
-
155
-
156
-
157
-
158
-
159
-
160
-
161
-
162
-
163
-
164
-
165
-
166
-
167
-
168
-
169
-
170
-
171
-
172
-
173
-
174
-
175
-
176
-
177
-
178
-
179
-
180
-
181
-
182
-
183
-
184
-
 185
185 -
 186
186 -
 187
187 -
 188
188 -
 189
189 -
 190
190 -
 191
191 -
 192
192 -
 193
193 -
 194
194 -
 195
195 -
 196
196 -
 197
197 -
 198
198 -
 199
199 -
 200
200 -
 201
201 -
 202
202 -
 203
203 -
 204
204 -
 205
205 -
206
-
207
-
208
-
209
-
210
-
211
-
212
-
213
-
214
-
215
-
216
-
217
-
218
-
219
-
220
-
221
-
222
-
223
-
224
-
225
-
226
-
227
-
228
-
229
-
230
-
231
-
232
-
233
-
234
-
235
-
236
-
237
-
238
-
239
-
240
-
241
-
242
-
243
-
244
-
245
-
246
-
247
-
248
-
249
-
250
-
251
-
252
-
253
-
254
-
255
-
256
-
257
-
258
-
259
-
260
-
261
-
262
-
263
-
264
-
265
-
266
-
267
-
268
-
269
-
270
-
271
-
272
-
273
-
274
-
275
-
276
-
277
-
278
-
279
-
280
-
281
-
282
-
283
-
284
-
285
-
286
-
287
-
288
-
289
-
290
-
291
-
292
-
293
-
294
-
295
-
296
-
297
-
298
-
299
-
300
-
301
-
302
-
303
-
304
-
305
-
306
-
307
-
308
-
309
-
310
-
311
-
312
-
313
-
314
-
315
-
316
-
317
-
318
-
319
-
320
 |
 |

2012 REGISTRATION DOCUMENT SCHNEIDER ELECTRIC 193
CONSOLIDATED FINANCIAL STATEMENTS AT DECEMBER31, 2012
5
NOTES TO THE CONSOLIDATED FINANCIAL STATEMENTS
Accounts receivable result from sales to end-customers, who are
widely spread both geographically and economically. Consequently,
the Group believes that there is no signifi cant concentration of
creditrisk.
In addition, the Group takes out substantial credit insurance and
uses other types of guarantees to limit the risk of losses on trade
accounts receivable.
Changes in provisions for impairment of short and long-term trade accounts receivable were as follows:
Full year 2012 Full year 2011
Provisions for impairment on January1 (259) (198)
Additions (53) (34)
Utilizations 22 31
Reversals of surplus provisions 23
Translation adjustments 33
Other (21) (64)
PROVISIONS FOR IMPAIRMENT ON DECEMBER31 (306) (259)
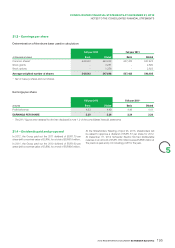
Note19
Other receivables and prepaid expenses
Dec.31, 2012 Dec.31, 2011
Other receivables 308 337
Other tax credits 641 1,039
Derivative instruments 170 82
Prepaid expenses 172 180
TOTAL 1,291 1,638
Note20
Cash and cash equivalents
Dec.31, 2012 Dec.31, 2011
Marketable securities 1,720 634
Negotiable debt securities and short-term deposits 443 622
Cash and cash equivalents 1,574 1,515
Total cash and cash equivalents 3,737 2,771
Bank overdrafts (120) (217)
NET CASH AND CASH EQUIVALENTS 3,617 2,554
Non-recourse factoring of trade receivables were realized during
the second semester of2012 for a total amount of EUR112million,
compared with EUR135million during the second semesterof2011.
Moreover, the Group had factored without recourse to a bank during
the second semester of2012 an income tax carry-back receivable
of EUR93million.