APC 2012 Annual Report Download - page 157
Download and view the complete annual report
Please find page 157 of the 2012 APC annual report below. You can navigate through the pages in the report by either clicking on the pages listed below, or by using the keyword search tool below to find specific information within the annual report.-
 1
1 -
2
-
3
-
4
-
5
-
6
-
7
-
8
-
9
-
10
-
11
-
12
-
13
-
14
-
15
-
16
-
17
-
18
-
19
-
20
-
21
-
22
-
23
-
24
-
25
-
26
-
27
-
28
-
29
-
30
-
31
-
32
-
33
-
34
-
35
-
36
-
37
-
38
-
39
-
40
-
41
-
42
-
43
-
44
-
45
-
46
-
47
-
48
-
49
-
50
-
51
-
52
-
53
-
54
-
55
-
56
-
57
-
58
-
59
-
60
-
61
-
62
-
63
-
64
-
65
-
66
-
67
-
68
-
69
-
70
-
71
-
72
-
73
-
74
-
75
-
76
-
77
-
78
-
79
-
80
-
81
-
82
-
83
-
84
-
85
-
86
-
87
-
88
-
89
-
90
-
91
-
92
-
93
-
94
-
95
-
96
-
97
-
98
-
99
-
100
-
101
-
102
-
103
-
104
-
105
-
106
-
107
-
108
-
109
-
110
-
111
-
112
-
113
-
114
-
115
-
116
-
117
-
118
-
119
-
120
-
121
-
122
-
123
-
124
-
125
-
126
-
127
-
128
-
129
-
130
-
131
-
132
-
133
-
134
-
135
-
136
-
137
-
138
-
139
-
140
-
141
-
142
-
143
-
144
-
145
-
146
-
 147
147 -
 148
148 -
 149
149 -
 150
150 -
 151
151 -
 152
152 -
 153
153 -
 154
154 -
 155
155 -
 156
156 -
 157
157 -
 158
158 -
 159
159 -
 160
160 -
 161
161 -
 162
162 -
 163
163 -
 164
164 -
 165
165 -
 166
166 -
 167
167 -
168
-
169
-
170
-
171
-
172
-
173
-
174
-
175
-
176
-
177
-
178
-
179
-
180
-
181
-
182
-
183
-
184
-
185
-
186
-
187
-
188
-
189
-
190
-
191
-
192
-
193
-
194
-
195
-
196
-
197
-
198
-
199
-
200
-
201
-
202
-
203
-
204
-
205
-
206
-
207
-
208
-
209
-
210
-
211
-
212
-
213
-
214
-
215
-
216
-
217
-
218
-
219
-
220
-
221
-
222
-
223
-
224
-
225
-
226
-
227
-
228
-
229
-
230
-
231
-
232
-
233
-
234
-
235
-
236
-
237
-
238
-
239
-
240
-
241
-
242
-
243
-
244
-
245
-
246
-
247
-
248
-
249
-
250
-
251
-
252
-
253
-
254
-
255
-
256
-
257
-
258
-
259
-
260
-
261
-
262
-
263
-
264
-
265
-
266
-
267
-
268
-
269
-
270
-
271
-
272
-
273
-
274
-
275
-
276
-
277
-
278
-
279
-
280
-
281
-
282
-
283
-
284
-
285
-
286
-
287
-
288
-
289
-
290
-
291
-
292
-
293
-
294
-
295
-
296
-
297
-
298
-
299
-
300
-
301
-
302
-
303
-
304
-
305
-
306
-
307
-
308
-
309
-
310
-
311
-
312
-
313
-
314
-
315
-
316
-
317
-
318
-
319
-
320
 |
 |

2012 REGISTRATION DOCUMENT SCHNEIDER ELECTRIC 155
BUSINESS REVIEW
4
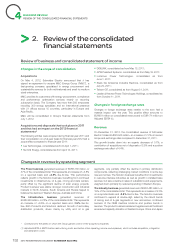
REVIEW OF THE CONSOLIDATED FINANCIAL STATEMENTS
Power recorded an adjusted EBITA margin of 20.7% for the year
ended December31, 2012, up 0.1% compared to20.6% for the
year ended December 31, 2011, due to sustained pricing and
productivity gains, offsetting negative geographical mix and costs
related to new product launches.
Infrastructure recorded an adjusted EBITA margin of 10.7% for the
year ended December31, 2012, up 0.3% compared to 10.4% for
the year ended December31, 2011, refl ecting strict cost control
and synergies delivered by acquisition integration.
Industry recorded an adjusted EBITA margin of 18.4% for the year
ended December31, 2012, up 0.8% compared to 17.6% for the
year ended December31, 2011, demonstrated strong resilience to
negative volume and unfavorable mix, thanks to pricing discipline,
productivity and good cost control.
IT recorded an adjusted EBITA margin of 19.0% for the year
ended December31, 2012, up 2.8% compared to 16.2% for the
year ended December31, 2011, helped by positive volume, price
actions, productivity gains, and improved solutions profi tability.
Buildings recorded an adjusted EBITA margin of 6.4% for the year
ended December 31, 2012, down 2.9% compared to 9.3% for
the year ended December31, 2011, refl ecting the softness of the
construction markets in its key countries and diffi culties of the video
security activity.
Corporate costs amounted to EUR501million for the year ended
December31, 2012 or 2.1% of Group revenues, stable compared
to the year ended December31, 2011 (2.1% of Group revenues or
EUR468million).
Operating income (EBIT)
Operating income (EBIT) increased from EUR2,811 million for
the year ended December31, 2011 to 2,866million for the year
ended December31, 2012, an increase of 2.0% despite a goodwill
impairment on Buildings CGU of EUR250million before tax effect
and an increase of amortization of intangibles linked to business
combinations of EUR16million (EUR224million on the year ended
December 31, 2012 compared to EUR208 million on the year
ended December31, 2011).
Net financial income/loss
Net fi nancial loss amounted to EUR405million for the year ended
December 31, 2012, compared to EUR415 million for the year
ended December31, 2011. This decrease is mainly linked to the
decrease in other fi nancial incomes and costs, from a net expense
of EUR114 million for year ended December 31, 2011 to a net
expense of EUR56 million for year ended December 31, 2012.
This is mainly due to the decrease of exchange loss (EUR21million
in2012 compared to EUR40million in2011) and to the gain on Axa
investment sale of EUR11million.
Within the net fi nancial loss, the increase in the cost of net fi nancial
debt from EUR301million for year ended December31, 2011 to
EUR349million for year ended December31, 2012 is triggered by
the increase in the average net debt between those two periods.
Tax
The effective tax rate was 23.1% for the year ended December31, 2012, slighty increasing compared to 22.8% for the year ended
December31, 2011. The corresponding tax expense increased from EUR547million for the year ended December31, 2011 to EUR568million
for the year ended December31, 2012.
Share of profit/(losses) of associates
The share of profi t of associates amounted to EUR34million for the year ended December31, 2012, compared to EUR28million for the year
ended December31, 2011, thanks to the increasing contribution of Electroshield in Russia and Sunten in China.
Non-controlling interests
Minority interests in net income for the year ended December31, 2012 totaled EUR87million, compared to EUR84million for the year
ended December31, 2011. This represented the share in net income attributable, in large part, to the minority interests of certain Chinese
companies.
Profit for the period
Profi t for the period attributable to the equity holders of our
parent company amounted to EUR1,840 million for the year
ended December 31, 2012, that is a 2.6% increase over the
EUR1,793million profi t for the year ended December31, 2011.
Before goodwill impairment of Buildings CGU of EUR250million
before tax effect and EUR183million after tax effect in2012 (and
EUR15 million of goodwill impairment in 2011), the profi t for the
period attributable to the equity holders of our parent company
amounted to EUR2,023million for the year ended December31,
2012, an increase of 11.9% compared to EUR1,808million in2011.