APC 2012 Annual Report Download - page 172
Download and view the complete annual report
Please find page 172 of the 2012 APC annual report below. You can navigate through the pages in the report by either clicking on the pages listed below, or by using the keyword search tool below to find specific information within the annual report.-
 1
1 -
2
-
3
-
4
-
5
-
6
-
7
-
8
-
9
-
10
-
11
-
12
-
13
-
14
-
15
-
16
-
17
-
18
-
19
-
20
-
21
-
22
-
23
-
24
-
25
-
26
-
27
-
28
-
29
-
30
-
31
-
32
-
33
-
34
-
35
-
36
-
37
-
38
-
39
-
40
-
41
-
42
-
43
-
44
-
45
-
46
-
47
-
48
-
49
-
50
-
51
-
52
-
53
-
54
-
55
-
56
-
57
-
58
-
59
-
60
-
61
-
62
-
63
-
64
-
65
-
66
-
67
-
68
-
69
-
70
-
71
-
72
-
73
-
74
-
75
-
76
-
77
-
78
-
79
-
80
-
81
-
82
-
83
-
84
-
85
-
86
-
87
-
88
-
89
-
90
-
91
-
92
-
93
-
94
-
95
-
96
-
97
-
98
-
99
-
100
-
101
-
102
-
103
-
104
-
105
-
106
-
107
-
108
-
109
-
110
-
111
-
112
-
113
-
114
-
115
-
116
-
117
-
118
-
119
-
120
-
121
-
122
-
123
-
124
-
125
-
126
-
127
-
128
-
129
-
130
-
131
-
132
-
133
-
134
-
135
-
136
-
137
-
138
-
139
-
140
-
141
-
142
-
143
-
144
-
145
-
146
-
147
-
148
-
149
-
150
-
151
-
152
-
153
-
154
-
155
-
156
-
157
-
158
-
159
-
160
-
161
-
 162
162 -
 163
163 -
 164
164 -
 165
165 -
 166
166 -
 167
167 -
 168
168 -
 169
169 -
 170
170 -
 171
171 -
 172
172 -
 173
173 -
 174
174 -
 175
175 -
 176
176 -
 177
177 -
 178
178 -
 179
179 -
 180
180 -
 181
181 -
 182
182 -
183
-
184
-
185
-
186
-
187
-
188
-
189
-
190
-
191
-
192
-
193
-
194
-
195
-
196
-
197
-
198
-
199
-
200
-
201
-
202
-
203
-
204
-
205
-
206
-
207
-
208
-
209
-
210
-
211
-
212
-
213
-
214
-
215
-
216
-
217
-
218
-
219
-
220
-
221
-
222
-
223
-
224
-
225
-
226
-
227
-
228
-
229
-
230
-
231
-
232
-
233
-
234
-
235
-
236
-
237
-
238
-
239
-
240
-
241
-
242
-
243
-
244
-
245
-
246
-
247
-
248
-
249
-
250
-
251
-
252
-
253
-
254
-
255
-
256
-
257
-
258
-
259
-
260
-
261
-
262
-
263
-
264
-
265
-
266
-
267
-
268
-
269
-
270
-
271
-
272
-
273
-
274
-
275
-
276
-
277
-
278
-
279
-
280
-
281
-
282
-
283
-
284
-
285
-
286
-
287
-
288
-
289
-
290
-
291
-
292
-
293
-
294
-
295
-
296
-
297
-
298
-
299
-
300
-
301
-
302
-
303
-
304
-
305
-
306
-
307
-
308
-
309
-
310
-
311
-
312
-
313
-
314
-
315
-
316
-
317
-
318
-
319
-
320
 |
 |

2012 REGISTRATION DOCUMENT SCHNEIDER ELECTRIC170
CONSOLIDATED FINANCIAL STATEMENTS AT DECEMBER31, 2012
5NOTES TO THE CONSOLIDATED FINANCIAL STATEMENTS
The effect of the restatement on the 2011 statement of cash-fl ows is as follows:
(in millions of euros)
FY 2011
published Restatement FY 2011
restated
Profi t for the year 1,904 (27) 1,877
Share of (profi t)/losses of associates, net of dividends received (28) (28)
Adjustments to reconcile net profi t to net cash fl ows provided by operating activities:
Depreciation of property, plant and equipment 386 386
Amortization of intangible assets other than goodwill 380 380
Impairment losses on non-current assets 31 31
Increase/(decrease) in provisions (89) (89)
Losses/(gains) on disposals of fi xed assets 12 12
Difference between tax paid and tax expense (65) (15) (80)
Other non-cash adjustments 48 48
Net cash provided by operating activities before changes in operating assets
and liabilities 2,579 (42) 2,537
Decrease/(increase) in accounts receivable (280) 50 (230)
Decrease/(increase) in inventories and work in process (38) (38)
(Decrease)/increase in accounts payable (41) (41)
Change in other current assets and liabilities 32 (8) 24
Change in working capital requirement (327) 42 (285)
Total I - Cash fl ows from operating activities 2,252 - 2,252
Total II – Cash fl ows from/(used in) investing activities (3,737) (3,737)
Total III – Cash fl ows from/(used in) fi nancing activities 909 909
IV – Net foreign exchange difference: (166) (166)
Increase/(decrease) in cash and cash equivalents: I +II +III +IV (742) - (742)
Cash and cash equivalents at January1 3,296 3,296
Increase/(decrease) in cash and cash equivalents (742) (742)
CASH AND CASH EQUIVALENTS AT DECEMBER31 2,554 2,554
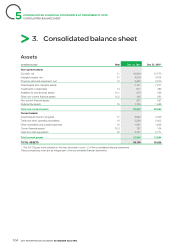
The effect of the restatement on the 2011 balance sheet is as follows:
(in millions of euros)
Dec.31, 2011
published Restatement Dec.31, 2011
restated
Non-current assets
Goodwill, net 12,773 12,773
Total tangible and intangible assets, net 7,277 7,277
Investments in associates 489 489
Non-current fi nancial assets 557 557
Deferred tax assets 1,444 24 1,468
Total non-current assets 22,540 24 22,564
Current assets
Inventories and work in progress 3,349 3,349
Trade and other operating receivables 5,484 (82) 5,402
Other receivables and prepaid expenses 1,638 1,638
Current fi nancial assets 104 104
Cash and cash equivalents 2,771 2,771
Total current assets 13,346 (82) 13,264
TOTAL ASSETS 35,886 (58) 35,828